. 2014 Mar 11;111(10):E962-71.
doi: 10.1073/pnas.1312567111. Epub 2014 Feb 24.

Task context impacts visual object processing differentially across the cortex

Affiliations

Task context impacts visual object processing differentially across the cortex

Assaf Harel et al. Proc Natl Acad Sci U S A. .

Abstract

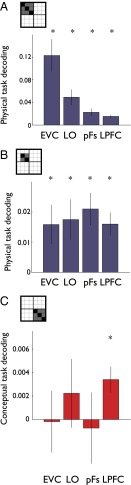
Perception reflects an integration of "bottom-up" (sensory-driven) and "top-down" (internally generated) signals. Although models of visual processing often emphasize the central role of feed-forward hierarchical processing, less is known about the impact of top-down signals on complex visual representations. Here, we investigated whether and how the observer's goals modulate object processing across the cortex. We examined responses elicited by a diverse set of objects under six distinct tasks, focusing on either physical (e.g., color) or conceptual properties (e.g., man-made). Critically, the same stimuli were presented in all tasks, allowing us to investigate how task impacts the neural representations of identical visual input. We found that task has an extensive and differential impact on object processing across the cortex. First, we found task-dependent representations in the ventral temporal and prefrontal cortex. In particular, although object identity could be decoded from the multivoxel response within task, there was a significant reduction in decoding across tasks. In contrast, the early visual cortex evidenced equivalent decoding within and across tasks, indicating task-independent representations. Second, task information was pervasive and present from the earliest stages of object processing. However, although the responses of the ventral temporal, prefrontal, and parietal cortex enabled decoding of both the type of task (physical/conceptual) and the specific task (e.g., color), the early visual cortex was not sensitive to type of task and could only be used to decode individual physical tasks. Thus, object processing is highly influenced by the behavioral goal of the observer, highlighting how top-down signals constrain and inform the formation of visual representations.

Keywords: fMRI; object recognition; occipitotemporal cortex; top-down processing; vision.


Conflict of interest statement

The authors declare no conflict of interest.

Figures

Fig. 1.
Fig. 1.
Experimental paradigm. (A) Examples of each of the eight objects presented (butterfly, cow, dresser, flower, motorcycle, roller skates, tree, vase). Six unique exemplars of each object were used, totaling 48 individual stimuli. Each stimulus was presented in each of the six tasks allowing us to compare the effect of task when the physical stimuli are held constant. (B) Sequence of events in a single trial. Each trial commenced with a cue specifying the task (physical tasks: fixation, color, tilt; conceptual tasks: content, movement, size), followed by a jittered ISI and then the presentation of the object stimulus. After another jittered ISI, a response screen was presented indicating the two response alternatives for that task and which button (left or right) was associated with each (response mapping).
Fig. 2.
Fig. 2.
Task effects on magnitude of response. Average response magnitude in each of the ROIs for the six tasks (physical tasks, blue; conceptual tasks, red) averaged across hemispheres. The EVC and LO showed a significant main effect of task, driven primarily by higher magnitude of response to the fixation task relative to all other tasks. *P < 0.05, Main effect of Task, assessed within each ROI by a Hemisphere × ROI ANOVA. Note that although the LPFC did not show a significant main effect, it displayed a significant Task × Hemisphere interaction (see text for details). n.s., not significant.
Fig. 3.
Fig. 3.
Comparison of multivoxel object and task responses. (A) Raw similarity matrices for the EVC, LO, pFs, and LPFC ROIs averaged across all participants. Each matrix is 48 × 48 cells (6 tasks × 8 objects), with each cell reflecting the correlation between a pair of conditions across two independent halves of the data. Solid lines denote borders between the two Task Types (physical, conceptual). Dashed lines denote borders between individual tasks. Note that the positive and negative correlations are generally well grouped by task, suggesting that information about task is manifest in the neural pattern of response of all visual ROIs as well as in LPFC. The colors are scaled from the highest (yellow) to lowest (cyan) correlation value in each matrix. (B) Organization of the similarity matrices. (C) Schematic matrices indicating how different effects would be manifest in the similarity matrices and how the decoding indices were calculated. Object information within task (Upper Left) is indicated by stronger correlations for the same object (black) than for different objects (gray). Object information across tasks (Upper Right) is indicated by stronger correlations for the same object in different tasks (black) compared with different objects (gray). Task type information (Lower Left) is indicated by stronger correlations between all conditions of the same task type (black), compared with those across task type (gray). Finally, task information (Lower Right) for each task type is indicated by stronger correlations between objects in the same task (black) compared with different tasks (gray).
Fig. 4.
Fig. 4.
Object decoding within and across tasks. (A) Examples of within-task object decoding (Left) and across-task object decoding (Right) averaged across tasks in the pFs. For each individual task, we focused on the 8 × 8 object similarity matrix and calculated within-task object decoding indices by subtracting the average between-object correlations (off-diagonals) from the within-object correlations (diagonal). Across-task object-decoding indices were calculated in a similar manner but focusing on the object similarity matrices comparing object response patterns in two different tasks and averaging across all possible pairwise comparisons of tasks. In this example for the pFs, strong object decoding within task is abolished when comparing across tasks. (B) Within-task object-decoding indices (green bars) and across-task indices (purple bars). Although within- and across-task object-decoding indices were significantly above chance in all ROIs except LPFC, the relative levels of within- and across-task decoding varied. In the EVC and LO, there was no difference in decoding, suggesting task-independent object representations. In contrast, in both the pFs and LPFC across-task decoding was significantly weaker then within-task decoding, suggesting task-dependent object representations. All error bars in this and every other plot indicate the between-subjects SE. *P < 0.05.
Fig. 5.
Fig. 5.
Task information. MDS plots highlighting the relationship between responses for each task in each ROI. The distance between points represents the similarity in the response patterns for the different conditions, with closer distance representing greater similarity. In the EVC and LO the structure strongly reflects the distinctiveness of the fixation task, with little grouping by Task Type. In contrast, the pFs and LPFC display a weaker separation of the fixation task, but also a strong grouping by Task Type, particularly in the LPFC. Response patterns in the LPFC also display a strong separation of the individual physical tasks.
Fig. 6.
Fig. 6.
Task Type information. (A) Task Type (physical, conceptual) decoding across the ROIs. Any decoding index significantly greater than zero indicates that the Task Type could be decoded in the region. Significant decoding was found in all regions, except for the EVC. *P < 0.05. (B) Comparison of response magnitude for physical and conceptual tasks averaged across the individual tasks. Bars show the difference in magnitude for conceptual and physical tasks with blue bars indicating stronger responses to physical tasks and red bars stronger response to conceptual tasks. In the EVC and LO, the physical tasks elicited a higher response relative to the conceptual tasks, but in pFs the reverse was true. In the LPFC, the effect of Task Type interacted with Hemisphere: Left hemisphere evidenced a conceptual task advantage, whereas the right hemisphere displayed a physical advantage. **P < 0.01.
Fig. 7.
Fig. 7.
Individual task decoding. Decoding of individual tasks within each Task Type. Any decoding index significantly greater than zero indicates that the task could be decoded from the others within the same Task Type. Schematic matrices illustrate the specific comparisons made to compute the indices. (A) Decoding of individual physical tasks. (B) Decoding of individual physical tasks (with fixation task removed from analysis). (C) Decoding of individual conceptual tasks. *P < 0.05.
Fig. 8.
Fig. 8.
Task and object representations in the parietal cortex. (A) Raw similarity matrix for the parietal ROI averaged across all participants. As in Fig. 4, the matrix is 48 × 48 cells (6 tasks × 8 objects), with each cell reflecting the correlation between a pair of conditions across two independent halves of the data (color-coded according the normalized correlation values). Solid lines denote borders between the two Task Types (physical, conceptual) and dashed lines denote borders between individual tasks. Note the strong grouping by both Task Type and by individual tasks within each Task Type. (B) MDS plot highlighting the relationship between responses pattern for each task. Note the clear separation between the physical (blue) and conceptual (red) tasks as a whole, as well as a clear separation within each type of task between the individual tasks. (C) Average response magnitude for the six tasks (physical tasks, blue; conceptual tasks, red) averaged across hemispheres. *P < 0.05, Main effect of Task, assessed by a Hemisphere × ROI ANOVA. (D) Object decoding indices within- and across-task (green and purple bars, respectively). Within- and across-task object-decoding indices were significantly above chance but there was no difference in decoding, suggesting task-independent object representations in parietal cortex, even though it contains rich task information. *P < 0.05.

Similar articles

Cited by

References

    1. Albright TD. On the perception of probable things: Neural substrates of associative memory, imagery, and perception. Neuron. 2012;74(2):227–245. - PMC - PubMed
    1. Bar M, Ullman S. Spatial context in recognition. Perception. 1996;25(3):343–352. - PubMed
    1. Lupyan G, Thompson-Schill SL, Swingley D. Conceptual penetration of visual processing. Psychol Sci. 2010;21(5):682–691. - PMC - PubMed
    1. Schyns PG, Rodet L. Categorization creates functional features. J Exp Psychol Learn. 1997;23(3):681–696.
    1. Wong AC, Palmeri TJ, Gauthier I. Conditions for facelike expertise with objects: Becoming a Ziggerin expert—But which type? Psychol Sci. 2009;20(9):1108–1117. - PMC - PubMed

LinkOut - more resources