. 2014 Jun;31(6):1581-92.
doi: 10.1093/molbev/msu081. Epub 2014 Feb 23.

A comprehensive, high-resolution map of a gene's fitness landscape

Affiliations

A comprehensive, high-resolution map of a gene's fitness landscape

Elad Firnberg et al. Mol Biol Evol. 2014 Jun.

Erratum in

Abstract

Mutations are central to evolution, providing the genetic variation upon which selection acts. A mutation's effect on the suitability of a gene to perform a particular function (gene fitness) can be positive, negative, or neutral. Knowledge of the distribution of fitness effects (DFE) of mutations is fundamental for understanding evolutionary dynamics, molecular-level genetic variation, complex genetic disease, the accumulation of deleterious mutations, and the molecular clock. We present comprehensive DFEs for point and codon mutants of the Escherichia coli TEM-1 β-lactamase gene and missense mutations in the TEM-1 protein. These DFEs provide insight into the inherent benefits of the genetic code's architecture, support for the hypothesis that mRNA stability dictates codon usage at the beginning of genes, an extensive framework for understanding protein mutational tolerance, and evidence that mutational effects on protein thermodynamic stability shape the DFE. Contrary to prevailing expectations, we find that deleterious effects of mutation primarily arise from a decrease in specific protein activity and not cellular protein levels.

Keywords: beta-lactamase; fitness landscape; protein evolution.


Figures

F<sc>ig</sc>. 1.
Fig. 1.
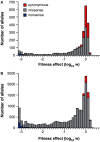
Distribution of gene fitness effects (DFE) of mutations in TEM-1. (A) The DFE of point mutations (i.e., 1-bp changes in the gene). (B) The DFE of all possible codon substitutions (i.e., all 1, 2, and 3 base changes in the 287 codons of TEM-1). Gene fitness values for conferring ampicillin resistance are presented on a log scale with 0 corresponding to the fitness of TEM-1. The contributions of synonymous (red), missense (gray), and nonsense (blue) mutations to the DFE are indicated. Gene fitness as a function of codon substitution is provided as supplementary data S1 (Supplementary Material online).
F<sc>ig</sc>. 2.
Fig. 2.
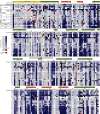
The sequence-function landscape of TEM-1. The heat map indicates the protein fitness values for ampicillin resistance of the indicated amino acid substitution. The Ambler consensus numbering system (Ambler et al. 1991) for class A β lactamases is used. An asterisk indicates key active site residues. For the start codon, fitness values correspond to the average of the codons for the indicated amino acid though methionine is expected to be the amino acid incorporated. Protein fitness as a function of missense mutation is provided as supplementary data S2 (Supplementary Material online).
F<sc>ig</sc>. 3.
Fig. 3.
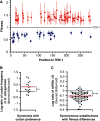
Effects of synonymous substitutions. (A) Beneficial and deleterious synonymous mutations in TEM-1 are not evenly distributed. Alleles synonymous to TEM-1 with a gene fitness significantly higher (red circles) or lower (blue squares) than that of TEM-1 are shown. The criteria for significance was that the error did not extend into the range fitness = 1 ± 0.1. Error bars provide an upper estimate on error on the fitness measurements as described in the text. (B) An analysis of pairs of synonymous alleles with mutations in codon positions 2–10 of the gene (supplementary figs. S6 and S7, Supplementary Material online) revealed that codon preferences tended to be for codons with a higher frequency in the Escherichia coli genome. (C) Preferred codons at positions 2–10 of the gene were predicted to result in mRNA with less stable structures around the initiation codon. Red bar is the mean. **P < 0.01, ****P < 0.0001 by Student’s t-test.
F<sc>ig</sc>. 4.
Fig. 4.
Tolerance of TEM-1 to missense mutation. Tolerance was measured by the effective number of amino acids at a position (k*), which derives from the distribution of protein fitness values for the 20 amino acids at that position. k* ranges in value from 1 (position is completely intolerant to substitution) to 20 (position tolerates all possible amino acids with no loss in fitness). (A) The distribution of k* values in TEM-1. (B) Correlation of k* correlates with percent solvent-accessible surface. (C) Correlation of k* with distance from the active site. (D) Correlation of k* with a sequence alignment of 156 class A β lactamases (Deng et al. 2012). (E) Model of TEM-1 (PDB ID 1XPB [Fonze et al. 1995]) indicating the least tolerant positions (k* < 2.5, shown in blue), which include the key active site residues S70, K73, S130, and E166, and the most tolerant positions (k* > 19, shown in red).
F<sc>ig</sc>. 5.
Fig. 5.
The determinants of protein fitness. (A) Loss of fitness correlates with loss of thermodynamic stability. Protein fitness is shown as a function of change in ΔG as predicted by Rosetta (Chaudhury et al. 2010) for 4,783 missense mutations in wild-type TEM-1. The median predicted ΔΔG for fitness deciles is shown in red triangles. Predicted changes >15 REU are not shown and are not considered in the median calculation. The distribution of ΔΔG for select fitness deciles can be found in supplementary figure S12A, Supplementary Material online. (B) Total cellular catalytic activity determines TEM-1 protein fitness. The average total cellular catalytic activity <vt> and the average protein abundance <P> were experimentally measured for 13 sublibraries of ∼15,000 unique TEM-1 alleles partitioned based on relative fitness. The values of <vt> and <P> are relative to that of TEM-1. The slight sigmoidal form of <vt> is an expected artifact of the methodology (supplementary fig. S14, Supplementary Material online). The error bars represent the standard deviation of six assays from two independent experiments. The lines are guides for the eye. (C) Protein fitness phase space defined by equation (3). The protein abundance and specific catalytic activity (relative to TEM-1) of 26 randomly selected members of sublibraries 6 (red solid circle) and 7 (blue open square) is shown. The dotted line corresponds to an equal decrease in protein abundance and specific catalytic activity. In region 1, a mutation affects specific catalytic activity more than protein abundance. The solid lines are of constant fitness at the average expected fitness values of the two sublibraries from which the alleles were randomly selected.

References

    1. Ambler RP, Coulson AF, Frere JM, Ghuysen JM, Joris B, Forsman M, Levesque RC, Tiraby G, Waley SG. A standard numbering scheme for the class A beta-lactamases. Biochem J. 1991;276(Pt 1):269–270. - PMC - PubMed
    1. Araya CL, Fowler DM, Chen W, Muniez I, Kelly JW, Fields S. A fundamental protein property, thermodynamic stability, revealed solely from large-scale measurements of protein function. Proc Natl Acad Sci U S A. 2012;109:16858–16863. - PMC - PubMed
    1. Bentele K, Saffert P, Rauscher R, Ignatova Z, Bluthgen N. Efficient translation initiation dictates codon usage at gene start. Mol Syst Biol. 2013;9:675. - PMC - PubMed
    1. Bershtein S, Mu W, Serohijos AW, Zhou J, Shakhnovich EI. Protein quality control acts on folding intermediates to shape the effects of mutations on organismal fitness. Mol Cell. 2013;49:133–144. - PMC - PubMed
    1. Bershtein S, Mu W, Shakhnovich EI. Soluble oligomerization provides a beneficial fitness effect on destabilizing mutations. Proc Natl Acad Sci U S A. 2012;109:4857–4862. - PMC - PubMed

Publication types