. 2014 Apr 1;192(7):3190-9.
doi: 10.4049/jimmunol.1302985. Epub 2014 Feb 24.

Regulator of fatty acid metabolism, acetyl coenzyme a carboxylase 1, controls T cell immunity

Affiliations

Regulator of fatty acid metabolism, acetyl coenzyme a carboxylase 1, controls T cell immunity

JangEun Lee et al. J Immunol. .

Abstract

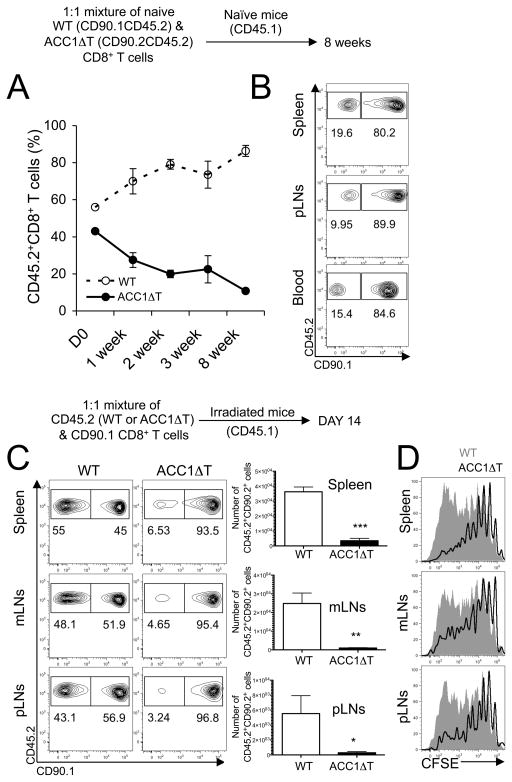
Fatty acids (FAs) are essential constituents of cell membranes, signaling molecules, and bioenergetic substrates. Because CD8(+) T cells undergo both functional and metabolic changes during activation and differentiation, dynamic changes in FA metabolism also occur. However, the contributions of de novo lipogenesis to acquisition and maintenance of CD8(+) T cell function are unclear. In this article, we demonstrate the role of FA synthesis in CD8(+) T cell immunity. T cell-specific deletion of acetyl coenzyme A carboxylase 1 (ACC1), an enzyme that catalyzes conversion of acetyl coenzyme A to malonyl coenzyme A, a carbon donor for long-chain FA synthesis, resulted in impaired peripheral persistence and homeostatic proliferation of CD8(+) T cells in naive mice. Loss of ACC1 did not compromise effector CD8(+) T cell differentiation upon listeria infection but did result in a severe defect in Ag-specific CD8(+) T cell accumulation because of increased death of proliferating cells. Furthermore, in vitro mitogenic stimulation demonstrated that defective blasting and survival of ACC1-deficient CD8(+) T cells could be rescued by provision of exogenous FA. These results suggest an essential role for ACC1-mediated de novo lipogenesis as a regulator of CD8(+) T cell expansion, and may provide insights for therapeutic targets for interventions in autoimmune diseases, cancer, and chronic infections.


Figures

Figure 1
Figure 1. ACC1 deficiency compromises de novo lipogenesis in T cells
(A) Real-time quantitative PCR analysis of ACC1 and ACC2 gene expression from naïve and effector CD8+ T cells after LmOVA infection. Mice were infected with LmOVA one day following transfer of 1 × 10³ OT-I cell per mouse, and donor cells were FACS sorted six days later. Results are presented relative to 18S (n=4). (B) Generation of mice with T cell-specific deletion of the ACC1 gene and confirmation of gene deletion in CD4+ and CD8+ T cells. Schematic presentation of the floxed allele and PCR analysis of ACC1 deletion in genomic DNA in FACS-purified CD4+, CD8+, B220+, CD11b+ cells from ACC1f/f (WT) and ACC1f/f Cd4-cre (ACC1ΔT) mice. IL-2 was an internal control. (C) Quantification of newly synthesized long-chain fatty acids in WT and ACC1ΔT CD8+ T cells by gas chromatography–mass spectrometry 24 hrs post activation in vitro. (WT n=6, ACC1ΔT n=4) (*p < 0.05 and **p < 0.001)
Figure 2
Figure 2. Loss of ACC1 impairs T cell homeostasis in the periphery
(A) Frequency of CD4+ and CD8+ T cells in the thymus, spleen, peripheral lymph nodes (pLNs), and blood from naive ACC1ΔT and WT littermate mice (7 weeks old). Shown are representative dot plots from five independent experiments (B) Numbers of isolated cells in the spleen and pLNs from ACC1ΔT mice and WT littermates (means±standard deviation) (C) Expression of various surface markers in splenic CD4+ and CD8+ T cells from WT and ACC1ΔT mice at 7 weeks old. Results are representative of at least 9 mice per group analyzed. (D) CD44 and CD62L expression profiles of CD4+ and CD8+ T cells and their frequencies in the spleen; results are representative of at least 9 mice per group. (*p < 0.05, **p < 0.001, and ***p < 0.0001)
Figure 3
Figure 3. Loss of ACC1 impairs CD8+ T cell persistence and homeostatic proliferation in the periphery
(A–B) 1:1 mixture of 2 × 10⁶ sorted naïve (CD44lowCD62LhighCD25neg) WT (CD90.1+CD45.2+) and ACC1ΔT (CD90.2+CD45.2+) CD8+ T cells were transferred into naïve congenic recipient mice (CD45.1+). Mice were bled at indicated time points and mononuclear cells were surface stained (n=3). (A) Longitudinal analysis of the frequency of WT and ACC1ΔT CD8+ T cells in the blood and (B) in various tissues 8 weeks post cell transfer (C) Lymphopenia-induced proliferation of WT or ACC1ΔT CD8+ T cells from the spleen, mesenteric LNs (mLNs), and pLNs was measured 14 days post transfer of CFSE-labeled naïve WT or ACC1ΔT CD8+ T cells (CD45.2+) into irradiated host mice (CD45.1+). Naïve CD90.1+ CD8+ T cells were co-transferred as reference cells. Dot plots show the frequency of WT or ACC1ΔT CD8+ T cells in comparison to that of reference cells from the same recipient mouse (n=5, one representative result shown from three independent experiments). (D) Histograms show CFSE dilution of transferred WT (grayed area) and ACC1ΔT CD8+ T cells (black line) from the spleen, mLNs, and pLNs. Graphs represent numbers of isolated WT and ACC1ΔT CD8+ T cells from indicated tissues (means±standard deviation, n=5) One representative result shown from three independent experiments. (*p < 0.05, **p < 0.001, and ***p < 0.0001)
Figure 4
Figure 4. ACC1 is required for accumulation of Ag-specific CD8+ T cells during LmOVA infection
1 × 10³ WT OT-I or ACC1ΔT OT-I (CD45.2+) cells were transferred into CD45.1+ recipients and infected with LmOVA. Seven days post-infection, single cells were prepared from spleens and stained for various surface markers, cytokines, and transcription factors. Data are representative of two independent experiments (n=8). (A) Dot plots show donor cells by CD45.2 and Kb/OVA tetramer (numbers indicate percent of total CD8+ T cells that are host- or donor-derived). Graph represents number of WT and ACC1ΔT OT-I cells (means ± standard deviation). (B) Dot plots show frequency of IFN-γ-producing WT and ACC1ΔT OT-I cells. Graphs represent number of IFN-γ producing WT and ACC1ΔT OT-I cells (means ± standard deviation). (C) The expression of surface markers, granzyme B, and transcription factors was determined in WT (grayed area) and ACC1ΔT OT-I (black line) cells. (***p < 0.0001)
Figure 5
Figure 5. ACC1 is essential for survival of proliferating CD8+ T cells
(A) OT-I cells (1 × 10⁴) from WT and ACC1ΔT (CD45.2+) mice were transferred into CD45.1+ recipients and infected with LmOVA one day later. Mice were injected with BrdU i.p. on day 5 post-infection. One hour post-BrdU injection, spleens were harvested and CD8+CD45.2+ donor-derived cells were analyzed for BrdU incorporation. Numbers indicate the percentage of BrdU positive cells among the donor CD45.2+ cells or donor CD45.2+ cells among CD8+ T cells. Data are representative of three independent experiments (n=3~5/group/experiment). (B) FACS-sorted naïve WT and ACC1ΔT CD8+ T cells (CD44lowCD62LhighCD25neg) were cultured alone or in the presence of IL-7 (1 ng/mL) for three days. Results are presented as relative live cell counts to those of WT cells cultured without anti-CD3 and anti-CD28 antibody stimulation (means ± standard deviation). Shown here is one representative result from at least four independent experiments. (C) FACS-sorted naïve WT and ACC1ΔT CD8+ T cells (CD44lowCD62LhighCD25neg) were cultured in the presence of anti-CD3 and anti-CD28 antibodies along with IL-2 for 24 hrs. Cells cultured without anti-CD3 and anti-CD28 antibodies were supplemented with IL-7 instead. Graph shows number of live cells (means ± standard deviation, n=4). (D) Histograms show dilution of cellular proliferation dye of WT (grayed area) and ACC1ΔT CD8+ (black line) T cells 72 hrs post-activation with anti-CD3 and anti-CD28 antibodies. Results are presented as live cell counts relative to those of WT cells cultured without anti-CD3 and anti-CD28 antibody stimulation (means ± standard deviation). One representative result shown from at least three independent experiments (***p < 0.0001)
Figure 6
Figure 6. Exogenous fatty acids rescue survival and proliferation of ACC1ΔT CD8+ T cells under mitogenic conditions
(A) FACS-sorted naïve WT or ACC1ΔT CD8+ T cells were labeled with proliferation dye and cultured with anti-CD3 and anti-CD28 antibodies alone or with 25uM FA supplement for 60 hrs in the presence of IL-2 (100 U/mL), and were then pulsed with BrdU for one hour, harvested, and stained for BrdU incorporation. Dot plots show dilution of proliferation dye and BrdU incorporating cells. Numbers in dot plots indicate percentage of BrdU incorporating cells in each group. Shown here is one representative result out of three independent experiments. (B) Analysis of cell enlargement by FACS 24hrs post activation with anti-CD3 and anti-CD28 antibodies alone or FA supplement. Cells were gated on live events (TO-PRO-3neg). Histograms show forward (FSC) and side scatter (SSC) of live WT (grayed area) and ACC1ΔT CD8+ (black line) T cells. Graphs summarize changes in FSC and SSC upon FAs supplement. Shown here is one representative result out of three independent experiments. (*p < 0.05, **p < 0.001 and ***p < 0.0001)

References

    1. van Stipdonk MJ, Hardenberg G, Bijker MS, Lemmens EE, Droin NM, Green DR, Schoenberger SP. Dynamic programming of CD8+ T lymphocyte responses. Nat Immunol. 2003;4:361–365. - PubMed
    1. Natter K, Kohlwein SD. Yeast and cancer cells - common principles in lipid metabolism. Biochim Biophys Acta. 1831:314–326. - PMC - PubMed
    1. Hannun YA, Obeid LM. The Ceramide-centric universe of lipid-mediated cell regulation: stress encounters of the lipid kind. J Biol Chem. 2002;277:25847–25850. - PubMed
    1. Robichaud PP, Boulay K, Munganyiki JE, Surette ME. Fatty acid remodeling in cellular glycerophospholipids following the activation of human T cells. J Lipid Res. 54:2665–2677. - PMC - PubMed
    1. Drake DR, 3rd, Braciale TJ. Cutting edge: lipid raft integrity affects the efficiency of MHC class I tetramer binding and cell surface TCR arrangement on CD8+ T cells. J Immunol. 2001;166:7009–7013. - PubMed

Publication types

MeSH terms