. 2014 Jan 13:7:193.
doi: 10.3389/fncom.2013.00193. eCollection 2013.

Parameters for burst detection

Affiliations

Parameters for burst detection

Douglas J Bakkum et al. Front Comput Neurosci. .

Abstract

Bursts of action potentials within neurons and throughout networks are believed to serve roles in how neurons handle and store information, both in vivo and in vitro. Accurate detection of burst occurrences and durations are therefore crucial for many studies. A number of algorithms have been proposed to do so, but a standard method has not been adopted. This is due, in part, to many algorithms requiring the adjustment of multiple ad-hoc parameters and further post-hoc criteria in order to produce satisfactory results. Here, we broadly catalog existing approaches and present a new approach requiring the selection of only a single parameter: the number of spikes N comprising the smallest burst to consider. A burst was identified if N spikes occurred in less than T ms, where the threshold T was automatically determined from observing a probability distribution of inter-spike-intervals. Performance was compared vs. different classes of detectors on data gathered from in vitro neuronal networks grown over microelectrode arrays. Our approach offered a number of useful features including: a simple implementation, no need for ad-hoc or post-hoc criteria, and precise assignment of burst boundary time points. Unlike existing approaches, detection was not biased toward larger bursts, allowing identification and analysis of a greater range of neuronal and network dynamics.

Keywords: burst detection; cell culture; information processing; microelectrode array; network dynamics.


Figures

Figure 1
Figure 1
(A) Network bursts (indicated in red) of varying durations of coincidental APs (raster dots) recorded across multiple channels. The majority of neurons mainly fired together within network bursts (columns of dots), but some also fired “tonically” outside of bursts (channels with gray dots). (B) Locations of the recording electrodes selected in the CMOS-based MEA (see Methods). Gray triangles correspond to the channels with gray dots in (A). Scale bar: 200 μm.
Figure 2
Figure 2
ISIN thresholds and burst detection. (A) The probability of elapsed times between consecutive spikes (black; ISI) and every Nth spike (gray) up to every 10th spike (red) are plotted. Elevated firing during network bursting corresponds to lower ISI, and the red arrow indicates the threshold for burst detection used in Figure 1. (B) The elapsed time between consecutive spikes is plotted vs. the elapsed time between every 10 spikes. Histograms correspond to the black and red probability distributions in (A), and the red and black arrows correspond to the ISI and ISIN thresholds in (A). For (A) and (B), ISIs were jittered by a random value between zero and one sample (50 μs) in order to better visualize the contribution from low ISIs. These would otherwise be plotted on top of each other in discrete lines corresponding to multiples of the sampling rate. The inset pie chart shows the percentage of spikes in each quadrant. Symbols match the spike markers in (C). (C) Detector performance for a segment of network activity. Black pluses and blue squares indicate spikes that would be classified in bursts (red bars) using an ISIN = 10 threshold. Black pluses and cyan circles indicate spikes that would be classified in bursts according to an ISIN = 2 threshold. Green triangles indicate spikes outside of bursts for either case.
Figure 3
Figure 3
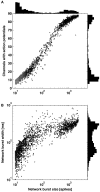
Distribution of burst sizes. Increasing burst size correlated to increasing number of contributing channels (A) and increasing burst width (B). Larger bursts covering the majority of channels and smaller bursts covering a subset of channels are clearly distinguishable by observing valleys in each of the three histograms.
Figure 4
Figure 4
Valleys in the bimodal ISIN probability distributions deepen with increasing N (light gray to dark gray) or with the inclusion of channels exhibiting tonic spiking (right panel). The distributions (black, red, light gray to dark gray) correspond to N equal to 2, 10, 50, 100, 250, 500, 1000, 2000, and 4000. The first peak disappears as N, the minimum burst size threshold, approaches the maximum burst size (~4000 spikes), which represents the trivial case of no spikes being within a burst. 8 out of 102 channels were identified as tonic according to the method presented in Figure 5. The inclusion of tonic channels can improve valley identification with a tradeoff of increased risk of identifying consecutive bursts as a single burst.
Figure 5
Figure 5
Quantifying levels of tonic activity. (A) Example network activity exhibiting bursting (red bars) and channels with high levels of tonic spiking (gray triangles). Spikes on all other active channels are indicated by black pluses. (B) The same network activity after introducing an artificial refractory period of 250 ms. Spikes during bursting became preferentially removed. (C) For each channel, the tonic (from B) vs. total (from A) firing rate is plotted. Channels with elevated tonic firing (gray triangles) match visual observations in (A) and (B).
Figure 6
Figure 6
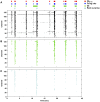
Performance of the ISIN = 10-threshold detector compared to example rate-threshold, ISI-threshold, and Rank Surprise detectors. (A) Burst times and durations for each detector (color bars and legend) applied to the network activity presented in the raster plot (each marker is one spike). The ISIN = 10-threshold and rate-threshold detectors were performed directly on the network spike train. The ISI-threshold and Rank Surprise detectors were performed on single-channel spike trains in a first stage. The respective single-channel burst events in (B) and (C) were then combined in a second stage to identify network bursts as described in the Methods.
Figure 7
Figure 7
An ISIN = 10-threshold detector identified small-sized bursts, and measured burst durations were shorter for a firing-rate-threshold or a rank surprise detector. (A–C) Each method was applied to 1-h long recordings from 3 cultures that each had different amounts of small bursts. The percentage of small bursts out of the total number of bursts, according to the ISIN = 10-threshold detector, were 80, 12, and 0% for (A–C), respectively. Each detector identified the largest bursts, and the ISIN = 10-threshold detector identified smaller bursts (left column). Since different detectors assign different durations to the same burst, one detector (ISIN = 10) was chosen as a reference (x-axis). In this manner, the same burst will be plotted at the same x-location, and its occurrence can be compared across detectors. Detected bursts had shorter durations for the firing-rate-threshold and rank surprise detectors. This was especially noticeable for cases with fewer short-duration small bursts in (B) and (C) (right column and D). Arrows in (B) correspond to examples of a large and a small burst in (D). (D) Plotted in (D) are durations of identified network bursts using each method (colored bars; top) and identified first-stage single-channel bursts using the ISI and Rank surprise methods (colored raster plots; each dot is a spike).
Figure 8
Figure 8
Rate-thresholds and burst detection for data presented in Figure 2. The probability distributions of (A) the total number of spikes or (B) the total number of electrodes that detected a spike within a time window between 5 and 50 ms in duration (lines) are plotted. Elevated firing during network bursting corresponds to higher spike or electrode counts, and the large arrows indicate the rate-threshold for burst detection used in (C). (C) Detector performance for a segment of network activity (black dots). Colored bars indicate detected bursts for each burst detector.

References

    1. Abeles M., Prut Y., Bergman H., Vaadia E. (1994). Synchronization in neuronal transmission and its importance for information-processing. Prog. Brain Res. 102, 395–404 10.1016/S0079-6123(08)60555-5 - DOI - PubMed
    1. Bakkum D. J., Chao Z. C., Potter S. M. (2008). Spatio-temporal electrical stimuli shape behavior of an embodied cortical network in a goal-directed learning task. J. Neural Eng. 5, 310–323 10.1088/1741-2560/5/3/004 - DOI - PMC - PubMed
    1. Bakkum D. J., Frey U., Radivojevic M., Russell T. L., Muller J., Fiscella M., et al. (2013). Tracking axonal action potential propagation on a high-density microelectrode array across hundreds of sites. Nat. Commun. 4, 2181 10.1038/ncomms3181 - DOI - PMC - PubMed
    1. Baruchi I., Ben-Jacob E. (2004). Functional holography of recorded neuronal networks activity. J. Neuroinform. 2, 333–352 10.1385/NI:2:3:333 - DOI - PubMed
    1. Cocatre-Zilgien J. H., Delcomyn F. (1992). Identification of bursts in spike trains. J. Neurosci. Methods 41, 19–30 10.1016/0165-0270(92)90120-3 - DOI - PubMed

LinkOut - more resources