. 2014 Feb 6:5:8.
doi: 10.3389/fphar.2014.00008. eCollection 2014.

Safety, tolerability, and biomarkers of the treatment of mice with aerosolized Toll-like receptor ligands

Affiliations

Safety, tolerability, and biomarkers of the treatment of mice with aerosolized Toll-like receptor ligands

Victoria Y Alfaro et al. Front Pharmacol. .

Abstract

We have previously discovered a synergistically therapeutic combination of two Toll-like receptor ligands, an oligodeoxynucleotide (ODN) and Pam2CSK4. Aerosolization of these ligands stimulates innate immunity within the lungs to prevent pneumonia from bacterial and viral pathogens. Here we examined the safety and tolerability of this treatment in mice, and characterized the expression of biomarkers of innate immune activation. We found that neutrophils appeared in lung lavage fluid 4 h after treatment, reached a peak at 48 h, and resolved by 7 days. The peak of neutrophil influx was accompanied by a small increase in lung permeability. Despite the abundance of neutrophils in lung lavage fluid, only rare neutrophils were visible histopathologically in the interstitium surrounding bronchi and veins and none were visible in alveolar airspaces. The cytokines interleukin 6 (IL-6), tumour necrosis factor, and Chemokine (C-X-C motif) ligand 2 rose several hundred-fold in lung lavage fluid 4 h after treatment in a dose-dependent and synergistic manner, providing useful biomarkers of lung activation. IL-6 rose fivefold in serum with delayed kinetics compared to its rise in lavage fluid, and might serve as a systemic biomarker of immune activation of the lungs. The dose-response relationship of lavage fluid cytokines was preserved in mice that underwent myeloablative treatment with cytosine arabinoside to model the treatment of hematologic malignancy. There were no overt signs of distress in mice treated with ODN/Pam2CSK4 in doses up to eightfold the therapeutic dose, and no changes in temperature, respiratory rate, or behavioral signs of sickness including sugar water preference, food disappearance, cage exploration or social interaction, though there was a small degree of transient weight loss. We conclude that treatment with aerosolized ODN/Pam2CSK4 is well tolerated in mice, and that innate immune activation of the lungs can be monitored by the measurement of inflammatory cytokines in lung lavage fluid and serum.

Keywords: Toll-like receptor; aerosol; innate immunity; lipopeptide; myeloablation; oligodeoxynucleotide; pneumonia.


Figures

FIGURE 1
FIGURE 1
Time-course of lung inflammatory responses to aerosolized O/P. (A,B) Mice were exposed to a single aerosolized 1× dose of O/P, then sacrificed at the indicated times, and cytokine concentrations were measured in the supernatants (A) and macrophage and neutrophil numbers were measured in the cell pellets (B) of lung lavage fluid. Cytokine levels differed from baseline for IL-6 at 2, 4, and 8 h, for CXCL2 at 2, 4, 8, 24 h, and for TNF at 2, 4, 24, 48 h (A). Leukocyte levels differed from baseline for macrophage at 96, 168, 672 h, and for neutrophils at 4, 8, 24, 48, 72 h (B). (C,D) Mice were exposed twice weekly for 3 weeks to aerosolized 1× doses of O/P, then sacrificed at the indicated times after the last dose, and cytokine concentrations were measured in the supernatants (C) and macrophage and neutrophil numbers were measured in the cell pellets (D) of lung lavage fluid. All three cytokines levels differed from baseline at 4 h (C). Macrophage levels differed from baseline only at 72 h, and neutrophil levels did not differ from baseline at any time (D). (n = 3–4 for all experiments).
FIGURE 2
FIGURE 2
Dose–response of lung inflammation to aerosolized O/P. (A,B) Mice were exposed to increasing concentrations of O/P as indicated, then sacrificed after 24 h to measure macrophage and neutrophil numbers (A) or after 4 h to measure cytokine levels (B). For comparison, the survival of mice exposed to increasing concentrations of O/P from challenge 24 h later with aerosolized P. aeruginosa is illustrated (A). Neutrophil levels differed from baseline at concentrations ≥1/4×, survival levels at concentrations ≥1/2×, macrophage levels at concentrations ≥1×, and levels of all three cytokines at all concentrations. (C) Mice were exposed to aerosolized 1× ODN alone, Pam2 alone, or ODN and Pam2 together, and cytokine levels in lung lavage fluid were measured 4 h later. Levels of all cytokines differed from baseline in response to all treatments except IL-6 in response to ODN alone, and the levels of IL-6 (p = 0.012) and TNF (p = 0.025) but not CXCL2 (p = 0.185) in response to ODN and Pam2 together were more than additive for responses to ODN alone and Pam2 alone. (n = 3–4 for all experiments).
FIGURE 3
FIGURE 3
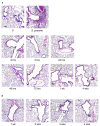
Histopathology of mouse lungs in response to aerosolized O/P. (A) Mice were exposed to a single aerosolized 1× dose of O/P, then sacrificed at the indicated times. Their lungs were fixed, embedded, and sectioned, then stained with H&E. For comparison, the lungs of a mouse sacrificed 24 h after challenge with aerosolized S. pneumoniae are illustrated. (B) Mice were exposed twice weekly for 3 weeks to aerosolized 1× doses of O/P, then sacrificed at the indicated times after the last dose, and their lungs were fixed, embedded, and sectioned, then stained with H&E. (n = 3–4 for all experiments).
FIGURE 4
FIGURE 4
Protection from Pseudomonas pneumonia and expression of biomarkers in myeloablated mice treated with aerosolized O/P. (A) Mice were (black symbols) or were not (gray symbols) given four intraperitoneal injections of cytosine arabinoside (AraC) over 8 days to ablate neutrophils. Mice from both groups were then treated (circles) or not (squares) with a 1× dose of aerosolized O/P, then challenged 24 h later with aerosolized P. aeruginosa. Survival of mice treated with O/P differed from survival of untreated mice regardless of whether they received AraC (n = 10). (B) Mice myeloablated with cytosine arabinoside were exposed to increasing concentrations of O/P as indicated, then sacrificed after 4 h for the measurement of cytokine concentrations in lung lavage fluid. Levels of all cytokines differed from baseline in response to all treatments (n = 4).
FIGURE 5
FIGURE 5
Lung permeability changes in response to aerosolized O/P. (A,B) Mice were exposed to a single 1× dose of aerosolized O/P, then sacrificed at the indicated times to measure protein concentration in lung lavage fluid (A) or lung weight (B). Asterisks indicate differences in comparison to mice treated with vehicle alone (n = 4 in A, 3 in B). (C) Mice on the left were exposed to increasing concentrations of aerosolized O/P as indicated, and those on the right were injected intravenously with amounts of O/P estimated to be 1, 10, 100, or 1,000-fold the amount deposited in the lungs after a single aerosolized 1× dose. All mice were injected intravenously with Evans blue dye at the time of exposure to aerosolized or intravenous O/P, then sacrificed after 48 h for measurement of the concentration of protein and Evans blue dye in lung lavage fluid. For comparison, mice were injected with oleic acid intravenously to induce a substantial increase in lung permeability. Asterisks indicate differences in comparison to mice treated with vehicle alone (n = 4).
FIGURE 6
FIGURE 6
Systemic inflammatory responses to aerosolized O/P. (A) Mice were exposed to increasing concentrations of O/P as indicated, then sacrificed after 4 h to measure cytokine levels in serum. IL-6 levels differed from baseline at concentrations of O/P ≥2×. (B) Mice were exposed to a single aerosolized 8× dose of O/P, then sacrificed at the indicated times, and the IL-6 concentration in serum was measured. The level of IL-6 differed significantly from baseline only at 48 h. (C) Mice were exposed to increasing concentrations of O/P as indicated, then sacrificed after 4 h to measure SAA1 transcript levels in their livers. Levels of SAA1 transcripts differed from baseline at concentrations of O/P ≥2×. (D) Mice were exposed to a single aerosolized 8× dose of O/P (black circles, Y-axis on the right), then sacrificed at the indicated times to measure SAA1 transcript levels in their livers. For comparison, mice were injected intravenously (gray squares, Y-axis on the left) with an amount of O/P estimated to be 100-fold the amount deposited in the lungs after a single aerosolized 8× dose. Levels of SAA1 transcripts differed from baseline at 24 and 48 h. (n = 4–5 for all experiments).
FIGURE 7
FIGURE 7
Physiologic responses to aerosolized O/P. (A,B) The weight (A) and temperature (B) of mice exposed to increasing concentrations of O/P as indicated by the various colored lines was recorded at the indicated times. Asterisks indicate differences in comparison to mice treated with vehicle alone. (C) The respiratory rate of mice treated with aerosolized vehicle alone (water, black circles), or 1× (gray squares) or 8× (gray triangles) O/P. There were no differences in comparison to mice treated with vehicle alone. (n = 4–5 for all experiments).
FIGURE 8
FIGURE 8
Behavioral response to aerosolized O/P. (A) Mice were exposed to increasing concentrations of aerosolized O/P (symbols with solid lines) or to saline solution (SAL) or lipopolysaccharide (LPS) given by intraperitoneal (i.p.) injection (symbols with dashed lines). For the next 4 days, their preference for lightly sweetened water (1%) over unsweetened water was measured. Statistical analysis was not performed because data points represent measurements from a single cage (n = 5). (B–E) Mice were exposed to 1× or 8× doses of aerosolized O/P and compared to mice exposed to aerosolized vehicle (water) or injected i.p. with LPS. The rate of food disappearance (B), seconds per 5 min spent in social interaction with a novel untreated age and sex matched mouse introduced into the cage (C), and the number of quadrant entries (D) and rears (E) per 5 min of mice introduced into novel cages were measured for the next 24 h. Asterisks indicate differences in comparison to mice treated with vehicle alone (n = 8).

References

    1. Barreda G. J., Lei X., Wierda W., Cortes J. E., Dickey B. F., Evans S. E., et al. (2013). Pneumonia during remission induction chemotherapy in patients with acute leukemia. Ann. Am. Thorac. Soc. 10 432–44010.1513/AnnalsATS.201304-097OC - DOI - PMC - PubMed
    1. Behrens E. M., Canna S. W., Slade K., Rao S., Kreiger P. A., Paessler M., et al. (2011). Repeated TLR9 stimulation results in macrophage activation syndrome-like disease in mice. J. Clin. Invest. 121 2264–227710.1172/JCI43157 - DOI - PMC - PubMed
    1. Bide R. W., Armour S. J., Yee E. (2000). Allometric respiration/body mass data for animals to be used for estimates of inhalation toxicity to young adult humans. J. Appl. Toxicol. 20 273–29010.1002/1099-1263(200007/08)20:4<273::AID-JAT657>3.0.CO;2-X - DOI - PubMed
    1. Briasoulis E., Pavlidis N. (2001). Noncardiogenic pulmonary edema: an unusual and serious complication of anticancer therapy. Oncologist 6 153–16110.1634/theoncologist.6-2-153 - DOI - PubMed
    1. Campbell J. D., Cho Y., Foster M. L., Kanzler H., Kachura M. A., Lum J. A., et al. (2009). CpG-containing immunostimulatory DNA sequences elicit TNF-alpha-dependent toxicity in rodents but not in humans. J. Clin. Invest. 119 2564–2576 10.1172/JCI38294 - DOI - PMC - PubMed