. 2014 Feb 6:5:1.
doi: 10.3389/fgene.2014.00001. eCollection 2014.

Cytoplasmic 5'-3' exonuclease Xrn1p is also a genome-wide transcription factor in yeast

Affiliations

Cytoplasmic 5'-3' exonuclease Xrn1p is also a genome-wide transcription factor in yeast

Daniel A Medina et al. Front Genet. .

Abstract

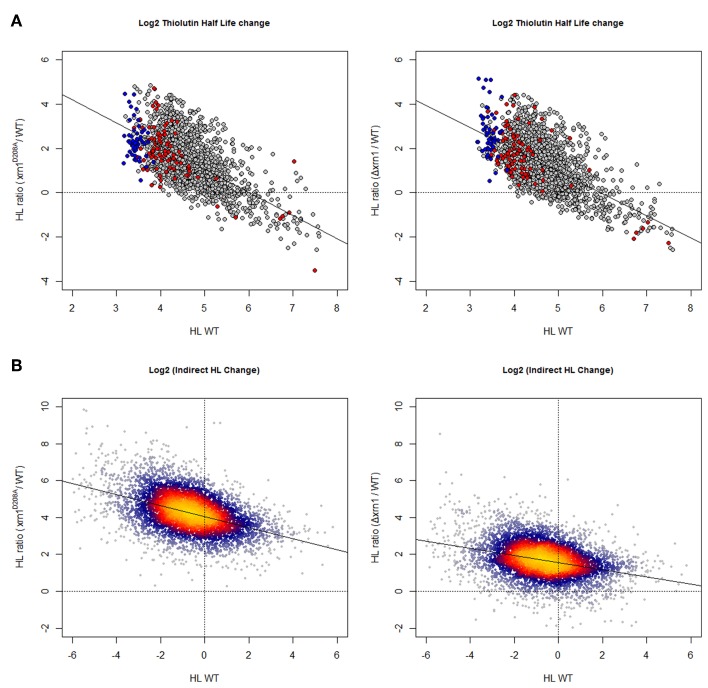
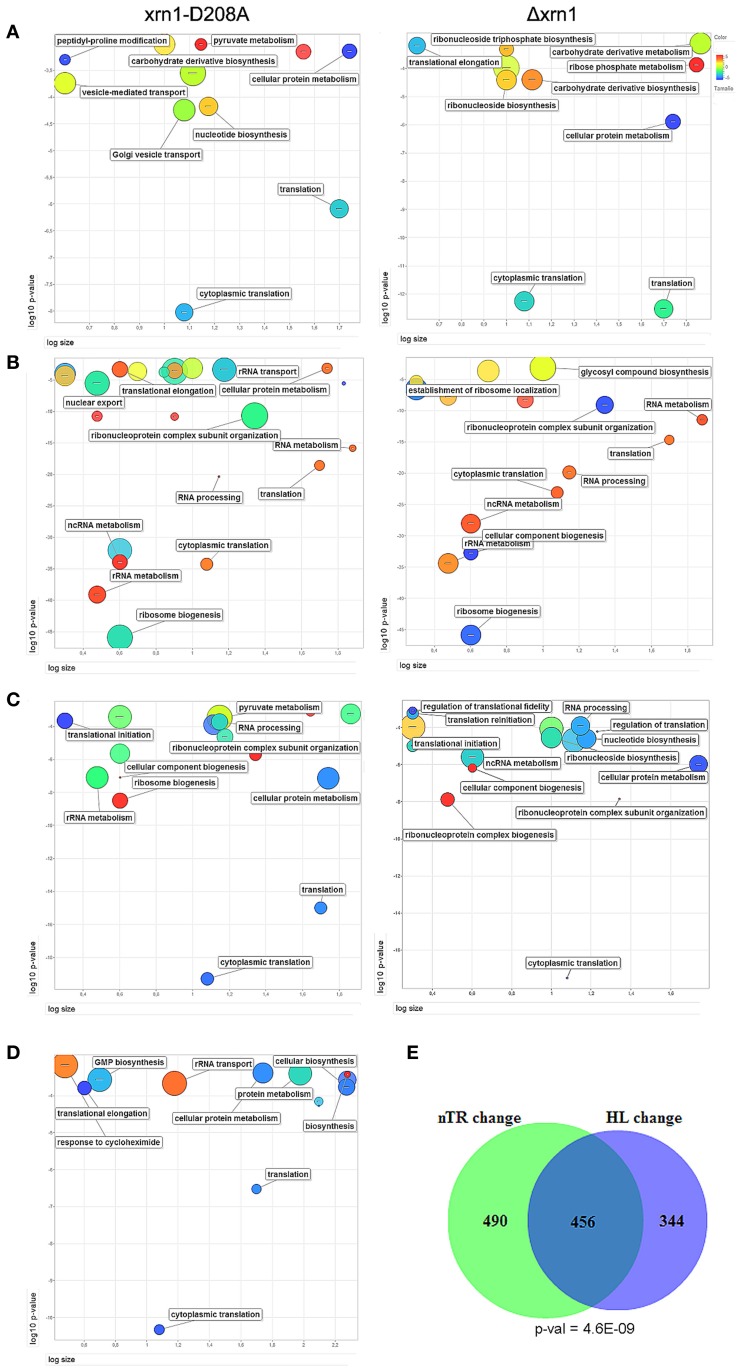
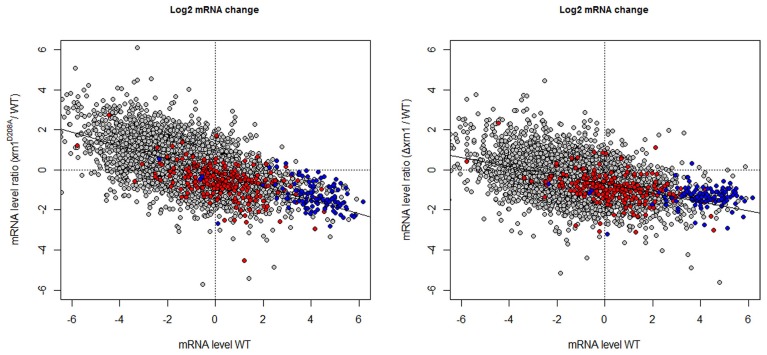
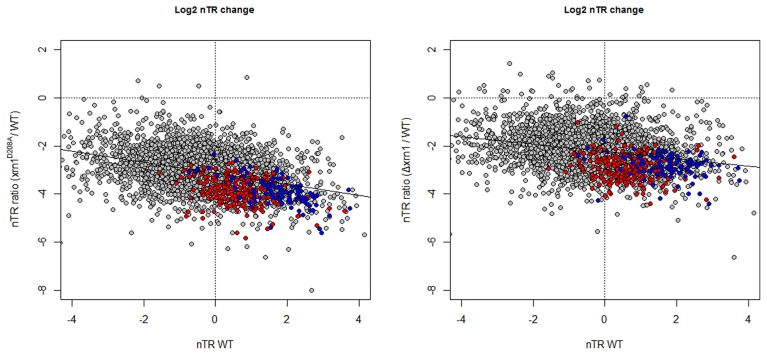
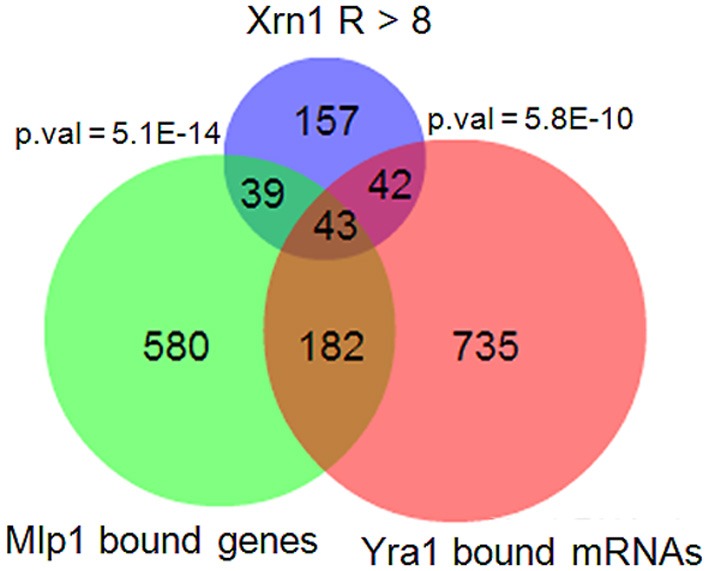
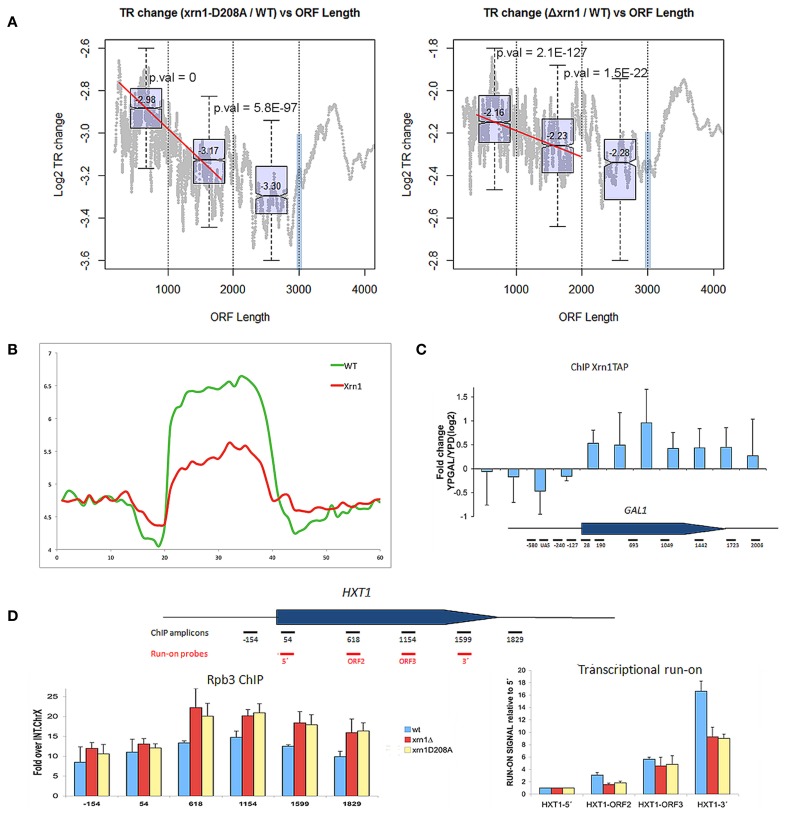
The 5' to 3' exoribonuclease Xrn1 is a large protein involved in cytoplasmatic mRNA degradation as a critical component of the major decaysome. Its deletion in the yeast Saccharomyces cerevisiae is not lethal, but it has multiple physiological effects. In a previous study, our group showed that deletion of all tested components of the yeast major decaysome, including XRN1, results in a decrease in the synthetic rate and an increase in half-life of most mRNAs in a compensatory manner. Furthermore, the same study showed that the all tested decaysome components are also nuclear proteins that bind to the 5' region of a number of genes. In the present work, we show that disruption of Xrn1 activity preferentially affects both the synthesis and decay of a distinct subpopulation of mRNAs. The most affected mRNAs are the transcripts of the highly transcribed genes, mainly those encoding ribosome biogenesis and translation factors. Previously, we proposed that synthegradases play a key role in regulating both mRNA synthesis and degradation. Evidently, Xrn1 functions as a synthegradase, whose selectivity might help coordinating the expression of the protein synthetic machinery. We propose to name the most affected genes "Xrn1 synthegradon."

Keywords: mRNA decay; mRNA stability; mRNA synthesis; nascent transcription; transcription rate.


Figures

Figure 1
Figure 1
Changes in mRNA HL due to disruption of Xrn1 inversely correlate with mRNA stability. (A) Plots of the ratios between mutant and wild-type HL against HL in the wild type (wt). The cloud shows 1915 data for the genes with confident HL measures in a shut-off with thiolutin in both wt and mutants (see Materials and methods for details). (B) The same kind of plots, but using 5400 data points from an indirect HL determination using the GRO protocol and mRNA level quantification by a macroarray analysis (García-Martínez et al., 2004). This method provides more data points, but they are mathematically linked to nTR and (mRNA). See the main text for discussion. The axes are on a log2 scale. Plots in (A) show genes for RP (blue) and RiBi (red) highlighted. Plots in (B) were done using the LSD packet (Schwalb et al., 2011) and show a color code proportional to gene density: from red (high) to blue (low).
Figure 2
Figure 2
ReViGO plots of the GO searches. Plots of the statistically overrepresented GOs among genes in the highest 20% change in the mutant against wt in the thiolutin HL determination (A) or nTR (B). A similar search for the genes with responsiveness ≥8 (C) and the genes bound by Xrn1 (D). ReViGO plots use previous GOrilla results for the Biological Process and plot the GO categories according to their p-value (Y-axis), the number of genes in category (X-axis) and semantic spaces (color and size of circle). The complete list of the GO categories found for the GO Biological Process and Cellular Component is presented in Table S2. The large overlap and its p-value between the genes most affected (quintiles >3, see Materials and methods) for both mutants in nTR and HL the Δxrn1 is shown (E).
Figure 3
Figure 3
Changes in the mRNA level in xrn1 mutants inversely correlate with the mRNA level. Plots of the ratios between the mutant and the wt mRNA level against the mRNA level in the wt. See Figure 1 for other details.
Figure 4
Figure 4
Changes in the nTR level in xrn1 mutants inversely correlate with nTR. Plots of the ratios between mutant and wt nTR against nTR in the wt. nTR was determined as in García-Martínez et al. (2004). The median nTR was defined arbitrarily as 1 (0 on the Log2 scale). Note that the ratios obtained for most genes are negative, indicating that the transcription in the mutant was lower than in the wt counterpart. See Figure 1 for other details.
Figure 5
Figure 5
Overlapping between Xrn1-synthegradon genes with genes bound by Mlp1 and the mRNAs bound by Yra1. The list of Xrn1-synthegradon genes (responsiveness index >8, this work) was crossed with the genes bound by Mlp1 (Casolari et al., 2004) and with mRNAs bound by Yra1 (Hieronymus and Silver, 2003). The overlaps are statistically significant (p-values for hypergeometric tests are shown). The overlaps with other Cse1 nuclear pore proteins studied in the same paper were also significant (Figure S4), but not with Nup60.
Figure 6
Figure 6
nTR decreases in xrn1 mutants. (A) Changes in nTR of the xrn1 mutants are plotted against ORF length. A decreasing tendency is clearly seen for the genes between 300 and 2000 bp. This is result is reinforced with the box-plots (distribution and median values and p-values for the difference between two consecutive groups) for the genes situated in each of the three groups of the distribution (0-1 kb, 1-2 kb, 2-3 kb). At 3 kb, a blue bar shows the artifact caused by the displacement toward 3′ during the run-on, which provokes a bias against long genes (see Pelechano et al., 2010). However, the ratio between xrn1 and wt should not be affected. This challenges the interpretation of the graphs, although it indicates that the behavior of the final 1 kb differs from the rest. (B) Presence of active RNA pol II along a “metagene” at a high resolution using BioGRO average for the whole yeast genome. On the Y-axis, the arbitrary fluorescence value indicates elongating RNA pol II density. On the X-axis region, from 0 to 20 represents 1 kb upstream of the gene on a real scale, and the region from 20 to 40 represents the gene region from TSS to TTS on a relative scale (all gene lengths become normalized), while the region from 40 to 60 represents 1 kb after TTS on a real scale. The relative height of the plateau in the wt and Δxrn1 mutant depicts the nTR along the whole average gene. (C) Binding Xrn1-TAP to the GAL1 gene, as measured by ChIP in the indicated amplicons. The ratio between the ChIP signal in YPGal, where GAL1 is transcriptionally active, and YPD, where GAL1 is repressed, is shown. (D) Distribution of RNA pol II across the HXT1 gene in the YPD-grown wild-type cells and in the isogenic xrn1 mutants. Total RNA pol II occupancy was followed by anti-Rpb3 ChIP. Active RNA pol II was followed by transcriptional run-on. Error bars indicate standard deviation.

References

    1. Alberola T. M., García-Martínez J., Antúnez O., Viladevall L., Barceló A., Ariño J., et al. (2004). A new set of DNA macrochips for the yeast Saccharomyces cerevisiae: features and uses. Int. Microbiol. 7, 199–206 - PubMed
    1. Bregman A., Avraham-Kelbert M., Barkai O., Duek L., Guterman A., Choder M. (2011). Promoter elements regulate cytoplasmic mRNA decay. Cell 147, 1473–1483 10.1016/j.cell.2011.12.005 - DOI - PubMed
    1. Casolari J. M., Brown C. R., Komili S., West J., Hieronymus H., Silver P. A. (2004). Genome-wide localization of the nuclear transport machinery couples transcriptional status and nuclear organization. Cell 117, 427–439 10.1016/S0092-8674(04)00448-9 - DOI - PubMed
    1. Eden E., Navon R., Steinfeld I., Lipson D., Yakhini Z. (2009). GOrilla: a tool for discovery and visualization of enriched GO terms in ranked gene lists. BMC Bioinformatics 10:48 10.1186/1471-2105-10-48 - DOI - PMC - PubMed
    1. Fierst J. L., Phillips P. C. (2012). Variance in epistasis links gene regulation and evolutionary rate in the yeast genetic interaction network. Genome Biol. Evol. 4, 1080–1087 10.1093/gbe/evs083 - DOI - PMC - PubMed