. 2013 Oct 23;3(1):29-41.
doi: 10.1016/j.molmet.2013.10.005. eCollection 2014 Feb.

Muscle insulin sensitivity and glucose metabolism are controlled by the intrinsic muscle clock

Affiliations

Muscle insulin sensitivity and glucose metabolism are controlled by the intrinsic muscle clock

Kenneth A Dyar et al. Mol Metab. .

Erratum in

Abstract

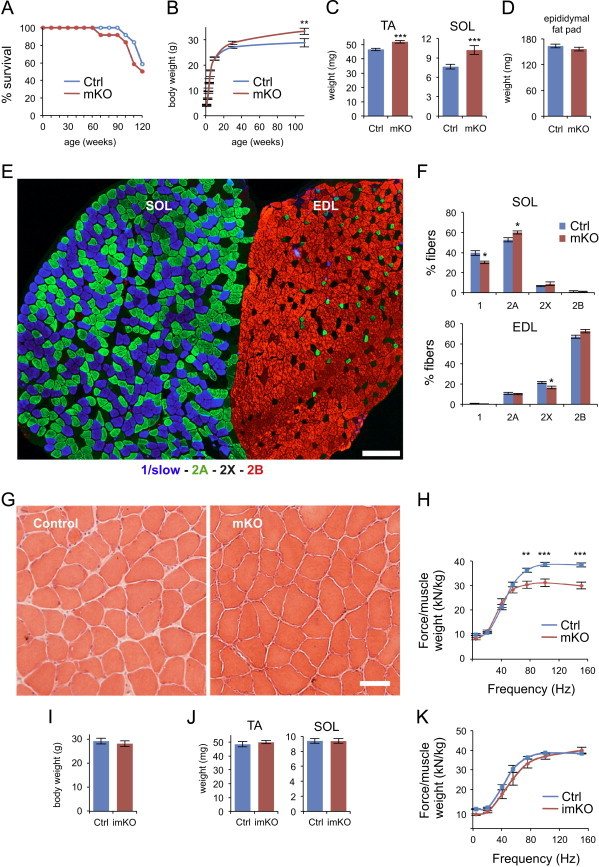
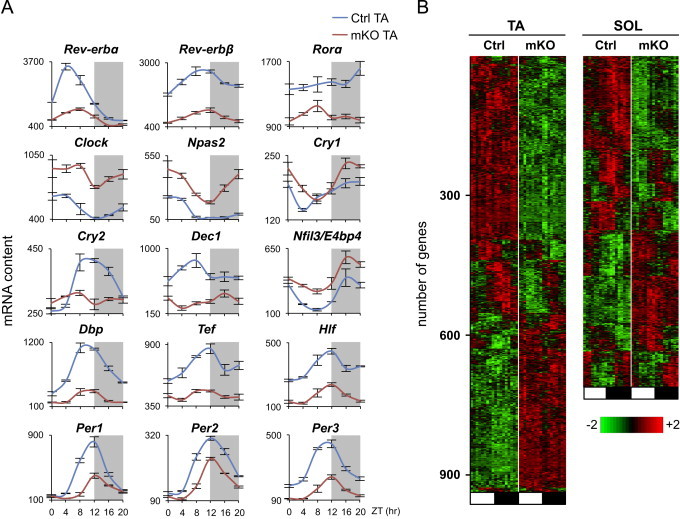
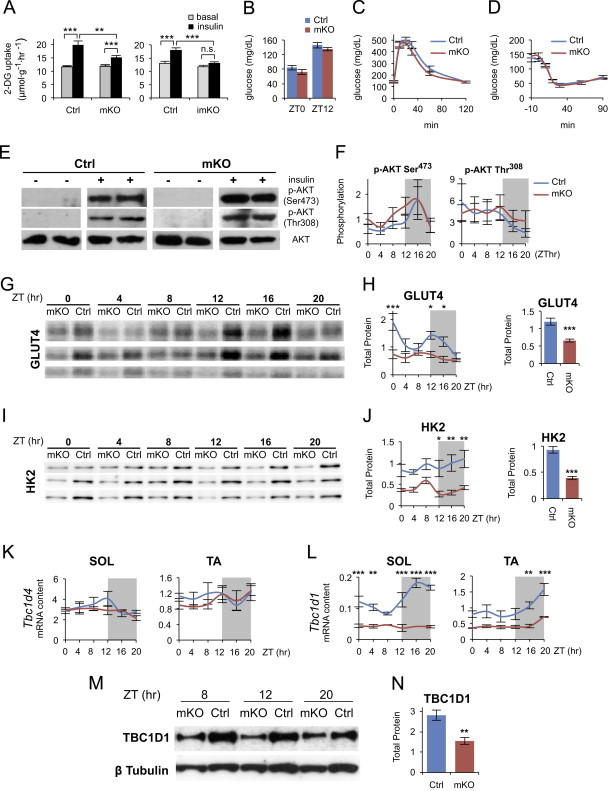
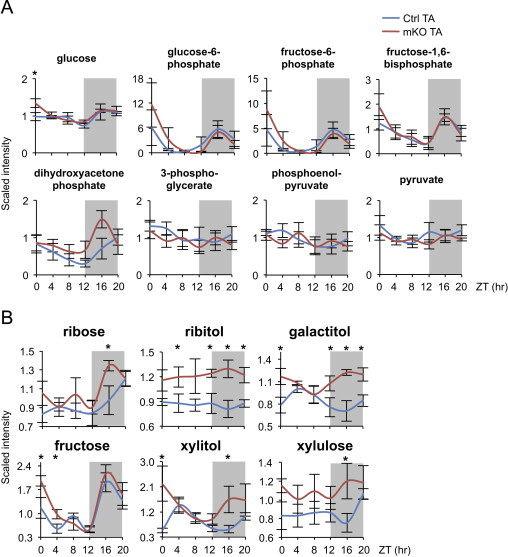
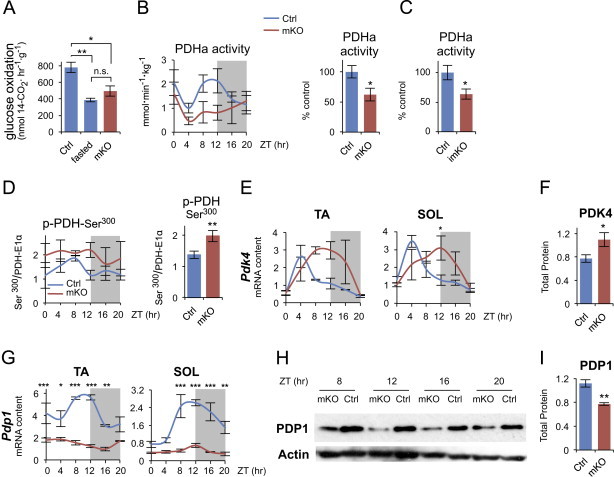
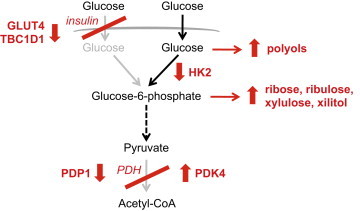
Circadian rhythms control metabolism and energy homeostasis, but the role of the skeletal muscle clock has never been explored. We generated conditional and inducible mouse lines with muscle-specific ablation of the core clock gene Bmal1. Skeletal muscles from these mice showed impaired insulin-stimulated glucose uptake with reduced protein levels of GLUT4, the insulin-dependent glucose transporter, and TBC1D1, a Rab-GTPase involved in GLUT4 translocation. Pyruvate dehydrogenase (PDH) activity was also reduced due to altered expression of circadian genes Pdk4 and Pdp1, coding for PDH kinase and phosphatase, respectively. PDH inhibition leads to reduced glucose oxidation and diversion of glycolytic intermediates to alternative metabolic pathways, as revealed by metabolome analysis. The impaired glucose metabolism induced by muscle-specific Bmal1 knockout suggests that a major physiological role of the muscle clock is to prepare for the transition from the rest/fasting phase to the active/feeding phase, when glucose becomes the predominant fuel for skeletal muscle.

Keywords: 2-DG, 2-Deoxyglucose; BSA, bovine serum albumin; Bmal1; Circadian rhythms; GSEA, Gene Set Enrichment Analysis; Glucose metabolism; Glucose uptake; HK2, hexokinase 2; KHB, Krebs–Henseleit buffer; Muscle insulin resistance; PDH, pyruvate dehydrogenase; PDK, PDH kinase; PDP, PDH phosphatase; SCN, suprachiasmatic nucleus; Skeletal muscle; ZT, Zeitgeber time; imKO, inducible muscle-specific Bmal1 knockout; mKO, muscle-specific Bmal1 knockout.


Figures

Figure 1
Figure 1
Characterization of skeletal muscle-specific Bmal1 knockout mice. (A) Survival curve of muscle-specific Bmal1 knockout mice (mKO) and control littermates (Ctrl) (n=12/group). (B) Body weight of control and mKO mice (mean±SEM; n=7–10/group/age; **p<0.01, 2-way ANOVA with the Bonferroni correction). (C) Weight of fast tibialis anterior (TA) and slow soleus (SOL) skeletal muscles from 5-month old mKO and control littermates (mean±SEM; n=36/group; ***p<0.001, Student's t-test). (D) Epididymal fat pad weight from 5-month old mKO and control littermates (mean±SEM; n=4/group). (E) Fiber type profile of slow soleus (SOL) and fast extensor digitorum longus (EDL) in transverse sections stained with anti-myosin antibodies specific for type-1/slow (blue), type-2A (green) and type 2B (red) myosin heavy chains. Type 2X fibers are unstained and appear black. Scale bar is 200 µμm. (F) Quantitation of the relative proportion of the different fiber types in SOL and EDL (mean±SEM, n=8 muscles per group with >90% of fibers measured; see methods; *p<0.05, Student's t-test). (G) Hematoxylin and eosin staining of transverse cryosections of SOL muscles from 26-month old mKO and control littermate. Scale bar is 50 µμm. (H) In vivo muscle force measurements performed on gastrocnemius muscles from 5-month old mKO and control littermates. Force normalized to muscle weight (mean±SEM, n=8–10 muscles per group; **p<0.01, ***p<0.001, 2-way ANOVA with Bonferroni correction). (I) Body weight of 7-month old inducible muscle-specific Bmal1 knockout mice (imKO, n=7) and control littermates (Ctrl, n=5) measured 5 months after tamoxifen injections (mean±SEM). (J) Weight of TA and SOL skeletal muscles from 7-month old imKO and control littermates measured 5 months after tamoxifen injections (mean±SEM; n=10–14/group). (K) In vivo muscle force measurements performed on gastrocnemius muscles from 7-month old imKO and control littermates 5 months after tamoxifen injection. Force normalized to muscle weight (mean±SEM, n=8–10 muscles per group).
Figure 2
Figure 2
Altered gene expression caused by skeletal muscle-specific Bmal1 knockout. (A) Circadian expression profiles of core clock and clock-associated genes in TA muscles from control and mKO mice. Transcript levels were determined by microarray analysis and plotted as mean absolute expression levels (mean±SEM; n=3/group/timepoint). (B) Phase map of differentially expressed genes in control and mKO skeletal muscles (TA and SOL) identified by maSigPro (see Section 2). Muscles were collected at 4-h intervals throughout the light (ZT0-ZT8, white box) and dark phase (ZT12–ZT20, black box) and hybridized to Affymetrix arrays as described in the methods (n=3/group/timepoint).
Figure 3
Figure 3
Insulin-dependent glucose uptake is impaired by muscle-specific Bmal1 deletion. (A) Insulin-stimulated [3H]-2-Deoxyglucose (2-DG) uptake by isolated SOL muscles from mKO (left panel) and imKO mice (right panel) versus respective controls (mean±SEM; n=15/group; **p<0.01, ***p<0.001, Student's t-test). (B) Fasting blood glucose levels at ZT0 (n=6/group) and ZT12 (n=10/group) from Ctrl and mKO mice (mean±SEM). (C) Glucose tolerance test performed at ZT12 in mKO mice versus control (mean±SEM; n=10/group). (D) Insulin tolerance test performed at ZT12 in mKO mice versus control (mean±SEM; n=8/group). (E) Basal (−) and insulin-induced (+) AKT Ser473 and Thr308 phosphorylation determined in isolated SOL muscles from mKO and Ctrl mice. (F) In situ diurnal AKT Ser473 phosphorylation (n=5/group/timepoint) and Thr308 phosphorylation (n=3/group/timepoint) in mKO and Ctrl gastrocnemius muscle quantified by densitometry after western blotting analysis (mean±SEM; arbitrary units; AKT Ser473 time effect F=2.88, p=0.02, 2-way ANOVA). (G) Western blots showing protein levels of GLUT4 across the day/night cycle in mKO and Ctrl gastrocnemius muscles from 36 different mice (n=3/group/timepoint). (H) Diurnal protein levels of GLUT4 quantified by densitometry after western blot analysis (mean±SEM; arbitrary units; n=5/group/timepoint; *p<0.05, ***p<0.001, 2-way ANOVA with Bonferroni correction, group effect F=32.2, p<0.0001; time effect F=4.45, p=0.002; group×time interaction F=2.64, p=0.03). Right panel shows mean 24-h GLUT4 protein levels (mean±SEM; arbitrary units; n=30/group; ***p<0.0001, Student's t-test). (I) Western blots showing protein levels of HK2 across the day/night cycle in mKO and Ctrl gastrocnemius muscles from 36 different mice (n=3/group/timepoint). (J) Diurnal protein levels of HK2 quantified by densitometry after western blot analysis (mean±SEM; arbitrary units; n=3/group/timepoint; *p<0.05, **p<0.01, 2-way ANOVA with the Bonferroni correction, group effect F=57.8, p<0.0001). Right panel shows mean 24-h HK2 protein levels (mean±SEM; arbitrary units; n=18/group; ***p<0.0001, Student's t-test). (K) and (L) Diurnal expression profiles of Tbc1d4 (K) and Tbc1d1 (L) transcripts in SOL and TA muscles from Ctrl and mKO mice detected by qPCR and plotted relative to 36B4 expression (mean±SEM; n=3/timepoint; **p<0.01, ***p<0.001, 2-way ANOVA with the Bonferroni correction). (M) Western blots showing TBC1D1 protein levels at three time points in mKO and Ctrl TA muscles. (N) Mean 24-h TBC1D1 protein levels in mKO and Ctrl TA muscles (mean±SEM; arbitrary units; n=4/group; **p<0.01, Student's t-test).
Figure 4
Figure 4
Altered sugar metabolites in skeletal muscles from Bmal1 mKO mice. (A) Diurnal variations of glycolytic metabolites in control (Ctrl) and mKO TA muscles (mean±SEM; n=5/group/timepoint; *p<0.05, repeated measures ANOVA). (B) Diurnal changes of other sugar metabolites in Ctrl and mKO TA muscles (mean±SEM; n=5/group/timepoint; *p<0.05, repeated measures ANOVA; see Table S1).
Figure 5
Figure 5
Altered glucose metabolism in skeletal muscles from Bmal1 mKO mice. (A) Glucose oxidation to CO2 measured in isolated diaphragms incubated with 5 mM [1-14C]-glucose at ZT12, at the light/dark transition (mean±SEM; n=5–10/group; *p<0.05, **p<0.01, Student's t-test). (B)–(D) Active pyruvate dehydrogenase (PDHa) activity and PDH phosphorylation in gastrocnemius muscles from Ctrl and mKO mice. (B) Diurnal pattern of PDHa activity. Data are expressed as mmoles/min/kg wet weight (mean±SEM; n=3/group/timepoint; 2-way ANOVA group effect F=6.66, p=0.016). Right panel shows mean 24-h PDHa activity in muscles from Ctrl and mKO mice (mean percent relative to control±SEM; n=18/group; *p<0.05, Student's t-test). (C) Mean 24-h PDHa activity in muscles from Ctrl (n=13) and imKO mice (n=16) (mean percent relative to control±SEM; *p<0.05, Student's t-test). (D) Diurnal PDH-E1α Ser300 phosphorylation quantified by densitometry after western blot analysis in muscles across the diurnal cycle (normalized to total PDH-E1α protein; mean±SEM; arbitrary units; n=3/group/timepoint; 2-way ANOVA group effect F=6.58, p=0.0173). Right panel shows mean 24-h PDH-E1α Ser300 phosphorylation in mKO and control muscles (mean±SEM; arbitrary units; n=18/group; **p<0.01, Student's t-test). (E) Diurnal gene expression profiles of PDH kinase 4 (Pdk4) in Ctrl and mKO TA and SOL muscles detected by qPCR and plotted relative to 36B4 expression (mean±SEM; n=3/group/timepoint; *p<0.05, 2-way ANOVA with the Bonferroni correction). (F) PDK4 protein levels in Ctrl and mKO muscles (gastrocnemius) immediately before and during the dark/active phase (average of values measured at ZT8, 12, 16 and 20) (mean±SEM; n=12; *p<0.05, Student's t-test). (G) Diurnal gene expression profiles of PDH phosphatase 1 (Pdp1) in Ctrl and mKO TA and SOL muscles detected by qPCR and plotted relative to 36B4 expression (mean±SEM; n=3/group/timepoint; *p<0.05, **p<0.01, ***p<0.001, 2-way ANOVA with the Bonferroni correction). (H) Western blots showing PDP1 protein levels, as measured immediately before and during the dark/active phase, in mKO and Ctrl gastrocnemius muscles. (I) PDP1 protein levels in mKO and Ctrl muscles (gastrocnemius) immediately before and during the dark/active phase (ZT8-20; mean±SEM; arbitrary units; n=4/group; **p<0.01, Student's t-test).
Figure 6
Figure 6
Glucose metabolism in skeletal muscles of Bmal1 mKO mice. In control mice glucose uptake is normally enhanced by insulin at the transition from the rest/fasting to the active/feeding phase, and PDH activity is increased by upregulation of PDP1 and downregulation of PDK4. In Bmal1 mKO mice, insulin-dependent glucose uptake is impaired due to decreased GLUT4 and TBC1D1 protein levels. As a result of reduced HK2 and PDHa activity, glucose metabolism is channeled to alternative pathways, including the polyol, pentose phosphate and glucuronic acid pathways.

References

    1. Asher G., Schibler U. Crosstalk between components of circadian and metabolic cycles in mammals. Cell Metabolism. 2011;13:125–137. - PubMed
    1. Green C.B., Takahashi J.S., Bass J. The meter of metabolism. Cell. 2008;134:728–742. - PMC - PubMed
    1. Huang W., Ramsey K.M., Marcheva B., Bass J. Circadian rhythms, sleep, and metabolism. Journal of Clinical Investigation. 2011;121:2133–2141. - PMC - PubMed
    1. Karlsson B., Knutsson A., Lindahl B. Is there an association between shift work and having a metabolic syndrome? Results from a population based study of 27,485 people. Occupational and Environmental Medicine. 2001;58:747–752. - PMC - PubMed
    1. Buxton O.M., Cain S.W., O'Connor S.P., Porter J.H., Duffy J.F., Wang W. Adverse metabolic consequences in humans of prolonged sleep restriction combined with circadian disruption. Science Translational Medicine. 2012;4:129ra143. - PMC - PubMed