

Irs2 and Irs4 synergize in non-LepRb neurons to control energy balance and glucose homeostasis
- PMID: 24567904
- PMCID: PMC3929908
- DOI: 10.1016/j.molmet.2013.10.004
Irs2 and Irs4 synergize in non-LepRb neurons to control energy balance and glucose homeostasis
Abstract
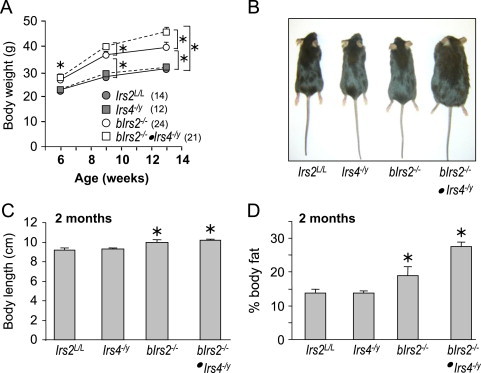
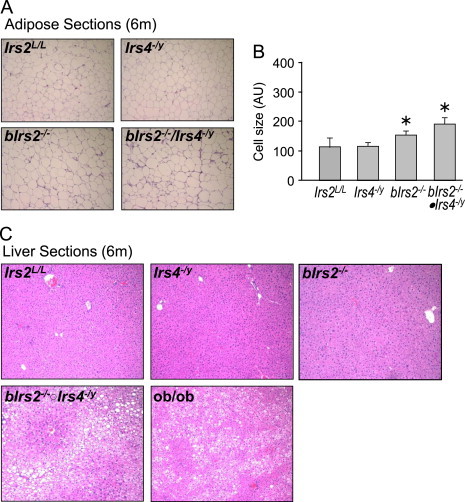
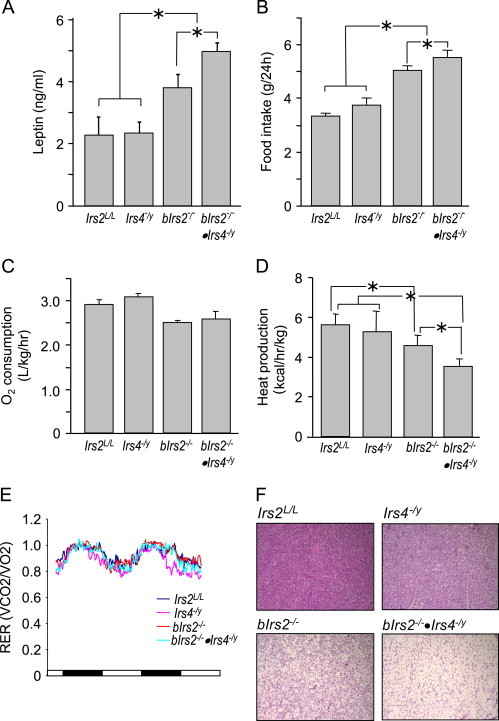
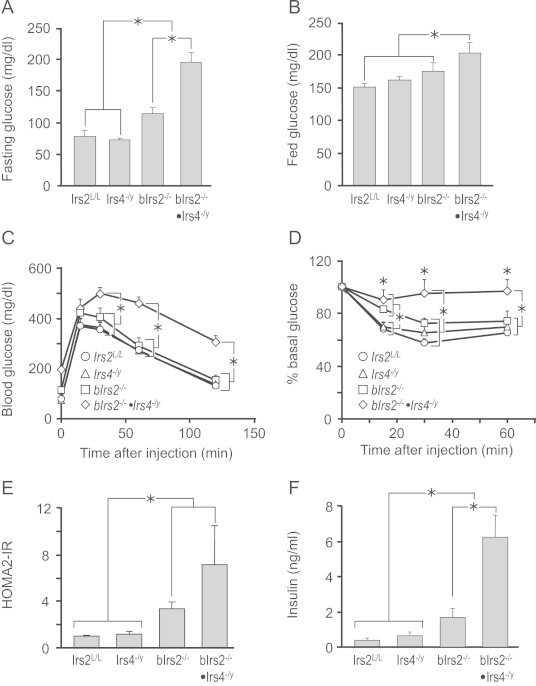
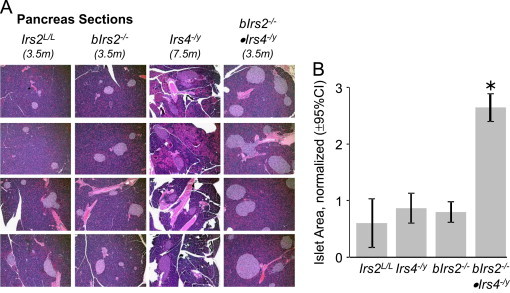
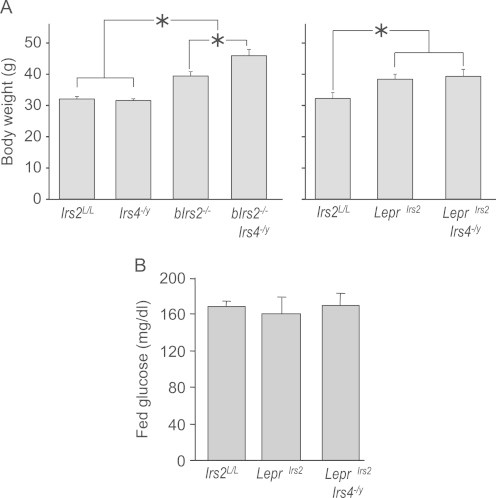
Insulin receptor substrates (Irs1, 2, 3 and Irs4) mediate the actions of insulin/IGF1 signaling. They have similar structure, but distinctly regulate development, growth, and metabolic homeostasis. Irs2 contributes to central metabolic sensing, partially by acting in leptin receptor (LepRb)-expressing neurons. Although Irs4 is largely restricted to the hypothalamus, its contribution to metabolic regulation is unclear because Irs4-null mice barely distinguishable from controls. We postulated that Irs2 and Irs4 synergize and complement each other in the brain. To examine this possibility, we investigated the metabolism of whole body Irs4(-/y) mice that lacked Irs2 in the CNS (bIrs2(-/-)·Irs4(-/y)) or only in LepRb-neurons (Lepr (∆Irs2) ·Irs4 (-/y) ). bIrs2(-/-)·Irs4(-/y) mice developed severe obesity and decreased energy expenditure, along with hyperglycemia and insulin resistance. Unexpectedly, the body weight and fed blood glucose levels of Lepr (∆Irs2) ·Irs4 (-/y) mice were not different from Lepr (∆Irs2) mice, suggesting that the functions of Irs2 and Irs4 converge upon neurons that are distinct from those expressing LepRb.
Keywords: ARC, arcuate nucleus of the hypothalamus; CNS, central nervous system; ERK, extracellular signal-regulated kinase; Energy balance; Insulin receptor substrate 2; Insulin receptor substrate 4; Irs2, insulin receptor substrate 2; Irs4, insulin receptor substrate 4; LepRb, leptin receptor; Leptin; Nutrient homeostasis; Obesity; PI3K, phosphatidylinositol 3-kinase; POMC, proopiomelanocortin; Socs3, suppressor of cytokine signaling-3; Stat3, signal transducer and activator of transcription 3.
Figures
Similar articles
-
Hypothalamic growth hormone receptor (GHR) controls hepatic glucose production in nutrient-sensing leptin receptor (LepRb) expressing neurons.Mol Metab. 2017 Mar 16;6(5):393-405. doi: 10.1016/j.molmet.2017.03.001. eCollection 2017 May. Mol Metab. 2017. PMID: 28462074 Free PMC article.
-
IRS2 signaling in LepR-b neurons suppresses FoxO1 to control energy balance independently of leptin action.Cell Metab. 2012 May 2;15(5):703-12. doi: 10.1016/j.cmet.2012.04.011. Cell Metab. 2012. PMID: 22560222 Free PMC article.
-
Over-expression of leptin receptors in hypothalamic POMC neurons increases susceptibility to diet-induced obesity.PLoS One. 2012;7(1):e30485. doi: 10.1371/journal.pone.0030485. Epub 2012 Jan 20. PLoS One. 2012. PMID: 22276206 Free PMC article.
-
Leptin receptor signaling and the regulation of mammalian physiology.Int J Obes (Lond). 2008 Dec;32 Suppl 7(Suppl 7):S8-12. doi: 10.1038/ijo.2008.232. Int J Obes (Lond). 2008. PMID: 19136996 Free PMC article. Review.
-
Is Insulin Receptor Substrate4 (IRS4) a Platform Involved in the Activation of Several Oncogenes?Cancers (Basel). 2023 Sep 20;15(18):4651. doi: 10.3390/cancers15184651. Cancers (Basel). 2023. PMID: 37760618 Free PMC article. Review.
Cited by
-
Insulin action in brain regulates systemic metabolism and brain function.Diabetes. 2014 Jul;63(7):2232-43. doi: 10.2337/db14-0568. Epub 2014 Jun 15. Diabetes. 2014. PMID: 24931034 Free PMC article. Review.
-
NEUROD1 reinforces endocrine cell fate acquisition in pancreatic development.Nat Commun. 2023 Sep 9;14(1):5554. doi: 10.1038/s41467-023-41306-6. Nat Commun. 2023. PMID: 37689751 Free PMC article.
-
Neurotrophins and Other Growth Factors in the Pathogenesis of Alzheimer's Disease.Life (Basel). 2023 Feb 26;13(3):647. doi: 10.3390/life13030647. Life (Basel). 2023. PMID: 36983803 Free PMC article. Review.
-
Variance Component Quantitative Trait Locus Analysis for Body Weight Traits in Purebred Korean Native Chicken.Asian-Australas J Anim Sci. 2016 Jan;29(1):43-50. doi: 10.5713/ajas.15.0193. Asian-Australas J Anim Sci. 2016. PMID: 26732327 Free PMC article.
-
IRS proteins and diabetic complications.Diabetologia. 2016 Nov;59(11):2280-2291. doi: 10.1007/s00125-016-4072-7. Epub 2016 Aug 11. Diabetologia. 2016. PMID: 27514532 Free PMC article. Review.
References
-
- Vogt M.C., Bruning J.C. CNS insulin signaling in the control of energy homeostasis and glucose metabolism – from embryo to old age. Trends in Endocrinology and Metabolism. 2013;24(2):76–84. - PubMed
-
- Myers M.G., Jr., Cowley M.A., Munzberg H. Mechanisms of leptin action and leptin resistance. Annual Review of Physiology. 2007;70:537–556. - PubMed
Grants and funding
LinkOut - more resources
Full Text Sources
Other Literature Sources
Molecular Biology Databases
Miscellaneous
