

Brain putamen volume changes in newly-diagnosed patients with obstructive sleep apnea
- PMID: 24567910
- PMCID: PMC3930100
- DOI: 10.1016/j.nicl.2014.01.009
Brain putamen volume changes in newly-diagnosed patients with obstructive sleep apnea
Abstract
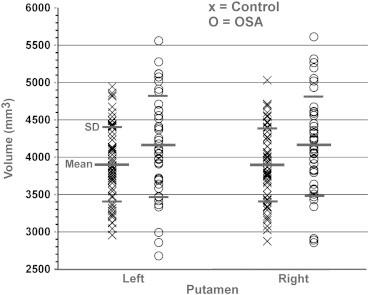
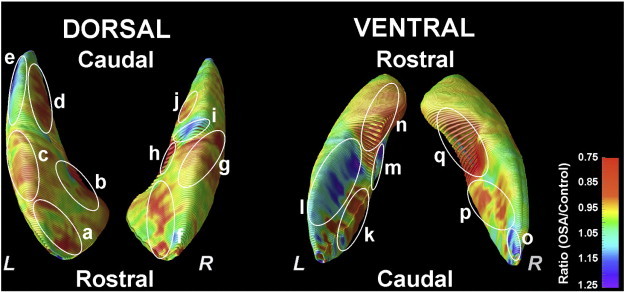
Obstructive sleep apnea (OSA) is accompanied by cognitive, motor, autonomic, learning, and affective abnormalities. The putamen serves several of these functions, especially motor and autonomic behaviors, but whether global and specific sub-regions of that structure are damaged is unclear. We assessed global and regional putamen volumes in 43 recently-diagnosed, treatment-naïve OSA (age, 46.4 ± 8.8 years; 31 male) and 61 control subjects (47.6 ± 8.8 years; 39 male) using high-resolution T1-weighted images collected with a 3.0-Tesla MRI scanner. Global putamen volumes were calculated, and group differences evaluated with independent samples t-tests, as well as with analysis of covariance (covariates; age, gender, and total intracranial volume). Regional differences between groups were visualized with 3D surface morphometry-based group ratio maps. OSA subjects showed significantly higher global putamen volumes, relative to controls. Regional analyses showed putamen areas with increased and decreased tissue volumes in OSA relative to control subjects, including increases in caudal, mid-dorsal, mid-ventral portions, and ventral regions, while areas with decreased volumes appeared in rostral, mid-dorsal, medial-caudal, and mid-ventral sites. Global putamen volumes were significantly higher in the OSA subjects, but local sites showed both higher and lower volumes. The appearance of localized volume alterations points to differential hypoxic or perfusion action on glia and other tissues within the structure, and may reflect a stage in progression of injury in these newly-diagnosed patients toward the overall volume loss found in patients with chronic OSA. The regional changes may underlie some of the specific deficits in motor, autonomic, and neuropsychologic functions in OSA.
Keywords: 3D surface morphometry; 3D, Three dimensional; AHI, Apnea–hypopnea index; Autonomic; BAI, Beck Anxiety Inventory; BDI-II, Beck Depression Inventory II; Basal ganglia; CSF, Cerebrospinal fluid; Cognition; ESS, Epworth Sleepiness Scale; FA, Flip angle; FOV, Field of view; GRAPPA, Generalized autocalibrating partially parallel acquisition; Intermittent hypoxia; MNI, Montreal Neurological Institute; MPRAGE, Magnetization prepared rapid acquisition gradient-echo; MRI, Magnetic resonance imaging; Magnetic resonance imaging; Motor; OSA, Obstructive sleep apnea; PD, Proton density; PSQI, Pittsburgh Sleep Quality Index; TE, Echo time; TIV, Total intracranial volume; TR, Repetition time.
Figures
Similar articles
-
Global and Regional Brain Non-Gaussian Diffusion Changes in Newly Diagnosed Patients with Obstructive Sleep Apnea.Sleep. 2016 Jan 1;39(1):51-7. doi: 10.5665/sleep.5316. Sleep. 2016. PMID: 26285005 Free PMC article.
-
Sex-specific hippocampus volume changes in obstructive sleep apnea.Neuroimage Clin. 2018 Jul 27;20:305-317. doi: 10.1016/j.nicl.2018.07.027. eCollection 2018. Neuroimage Clin. 2018. PMID: 30101062 Free PMC article.
-
Associations between brain white matter integrity and disease severity in obstructive sleep apnea.J Neurosci Res. 2016 Oct;94(10):915-923. doi: 10.1002/jnr.23788. Epub 2016 Jun 18. J Neurosci Res. 2016. PMID: 27315771 Free PMC article.
-
Diagnostic accuracy of the Berlin questionnaire, STOP-BANG, STOP, and Epworth sleepiness scale in detecting obstructive sleep apnea: A bivariate meta-analysis.Sleep Med Rev. 2017 Dec;36:57-70. doi: 10.1016/j.smrv.2016.10.004. Epub 2016 Nov 5. Sleep Med Rev. 2017. PMID: 27919588 Review.
-
Affective brain areas and sleep-disordered breathing.Prog Brain Res. 2014;209:275-93. doi: 10.1016/B978-0-444-63274-6.00014-X. Prog Brain Res. 2014. PMID: 24746053 Free PMC article. Review.
Cited by
-
Parkinson's disease and Parkinsonism syndromes: Evaluating iron deposition in the putamen using magnetic susceptibility MRI techniques - A systematic review and literature analysis.Heliyon. 2024 Mar 26;10(7):e27950. doi: 10.1016/j.heliyon.2024.e27950. eCollection 2024 Apr 15. Heliyon. 2024. PMID: 38689949 Free PMC article.
-
Aberrant Insular Functional Network Integrity in Patients with Obstructive Sleep Apnea.Sleep. 2016 May 1;39(5):989-1000. doi: 10.5665/sleep.5738. Sleep. 2016. PMID: 26943471 Free PMC article.
-
Gray matter volume and estimated brain age gap are not linked with sleep-disordered breathing.Hum Brain Mapp. 2020 Aug 1;41(11):3034-3044. doi: 10.1002/hbm.24995. Epub 2020 Apr 2. Hum Brain Mapp. 2020. PMID: 32239749 Free PMC article.
-
Sleep, cerebrospinal fluid, and the glymphatic system: A systematic review.Sleep Med Rev. 2022 Feb;61:101572. doi: 10.1016/j.smrv.2021.101572. Epub 2021 Nov 18. Sleep Med Rev. 2022. PMID: 34902819 Free PMC article.
-
Reliability of automated brain volumetric analysis: A test by comparing NeuroQuant and volBrain software.Brain Behav. 2023 Dec;13(12):e3320. doi: 10.1002/brb3.3320. Epub 2023 Nov 23. Brain Behav. 2023. PMID: 37997504 Free PMC article.
References
-
- Sleep-related breathing disorders in adults: recommendations for syndrome definition and measurement techniques in clinical research. The Report of an American Academy of Sleep Medicine Task Force. Sleep. 1999;22:667–689. - PubMed
-
- Ahlhelm F., Schneider G., Backens M., Reith W., Hagen T. Time course of the apparent diffusion coefficient after cerebral infarction. Eur. Radiol. 2002;12:2322–2329. - PubMed
-
- Alexander G.E., Crutcher M.D. Preparation for movement: neural representations of intended direction in three motor areas of the monkey. J. Neurophysiol. 1990;64:133–150. - PubMed
-
- Alkan A., Sharifov R., Akkoyunlu M.E., Kilicarslan R., Toprak H., Aralasmak A., Kart L. MR spectroscopy features of brain in patients with mild and severe obstructive sleep apnea syndrome. Clin. Imaging. 2013;37:989–992. - PubMed
-
- Asghari A., Mohammadi F., Kamrava S.K., Tavakoli S., Farhadi M. Severity of depression and anxiety in obstructive sleep apnea syndrome. Eur. Arch. Otorhinolaryngol. 2012;269:2549–2553. - PubMed
Publication types
MeSH terms
Grants and funding
LinkOut - more resources
Full Text Sources
Other Literature Sources
Medical
