. 2014 Mar;61(3):428-40.
doi: 10.1109/TUFFC.2014.2928.

Ultrasonic multipath and beamforming clutter reduction: a chirp model approach

Ultrasonic multipath and beamforming clutter reduction: a chirp model approach

Brett Byram et al. IEEE Trans Ultrason Ferroelectr Freq Control. 2014 Mar.

Abstract

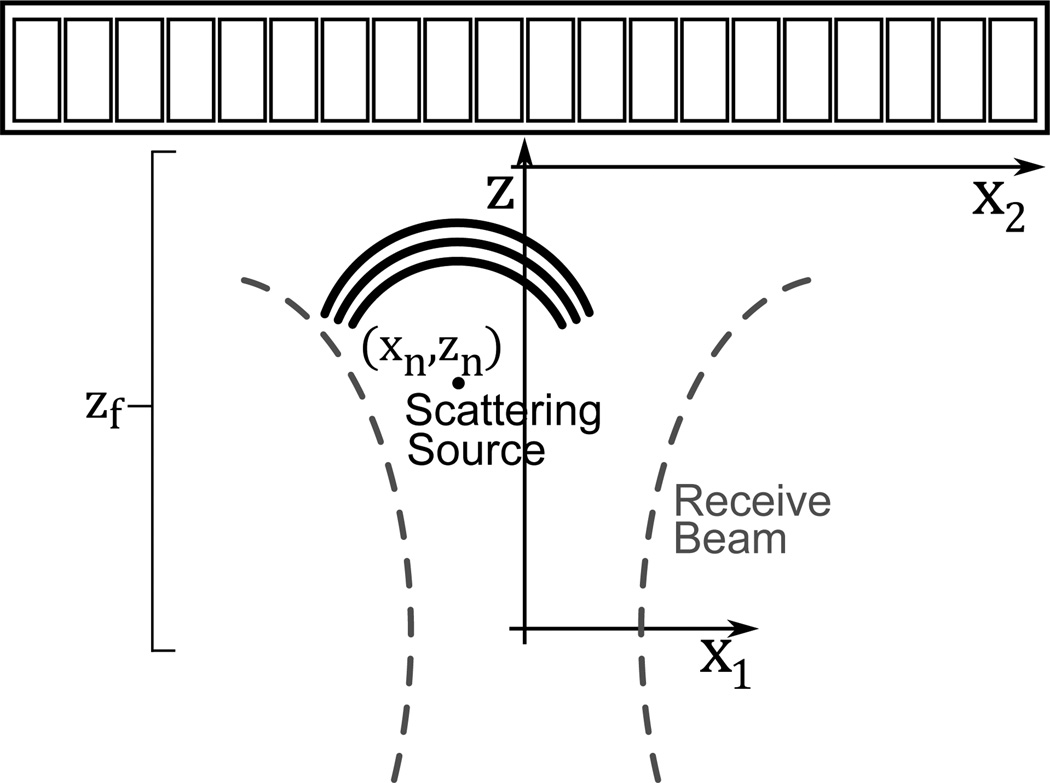
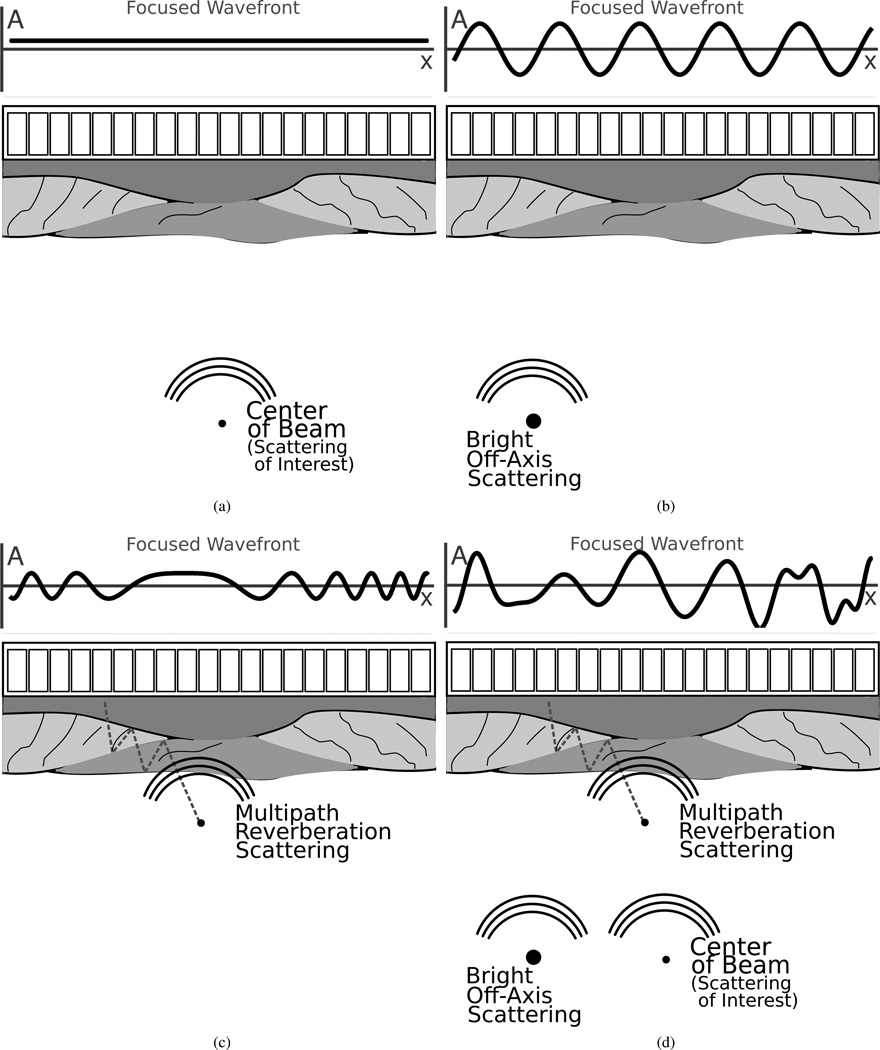
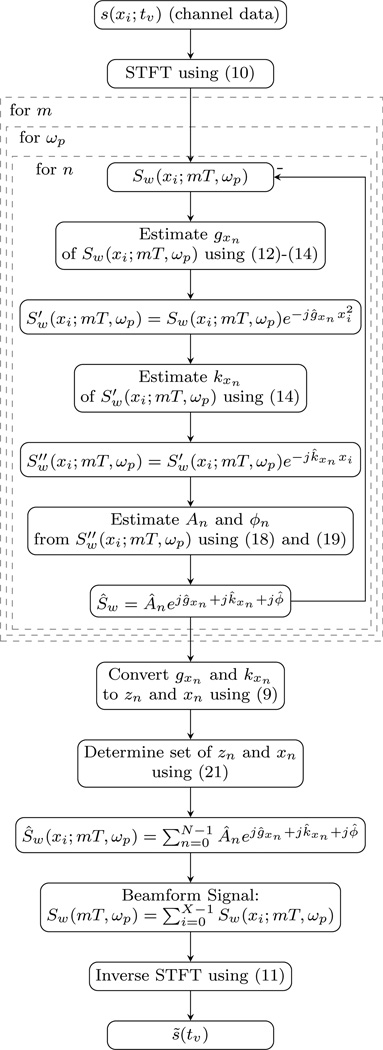
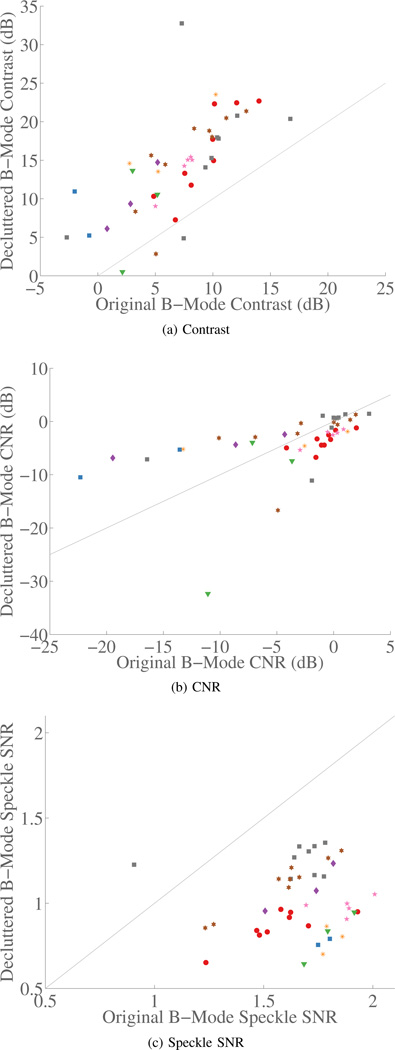
In vivo ultrasonic imaging with transducer arrays suffers from image degradation resulting from beamforming limitations, including diffraction-limited beamforming and beamforming degradation caused by tissue inhomogeneity. Additionally, based on recent studies, multipath scattering also causes significant image degradation. To reduce degradation from both sources, we propose a model-based signal decomposition scheme. The proposed algorithm identifies spatial frequency signatures to decompose received wavefronts into their most significant scattering sources. Scattering sources originating from a region of interest are used to reconstruct decluttered wavefronts, which are beamformed into decluttered RF scan lines or A-lines. To test the algorithm, ultrasound system channel data were acquired during liver scans from 8 patients. Multiple data sets were acquired from each patient, with 55 total data sets, 43 of which had identifiable hypoechoic regions on normal B-mode images. The data sets with identifiable hypoechoic regions were analyzed. The results show the decluttered B-mode images have an average improvement in contrast over normal images of 7.3 ± 4.6 dB. The contrast-to-noise ratio (CNR) changed little on average between normal and decluttered Bmode, -0.4 ± 5.9 dB. The in vivo speckle SNR decreased; the change was -0.65 ± 0.28. Phantom speckle SNR also decreased, but only by -0.40 ± 0.03.


Figures

Fig. 1
Fig. 1
The coordinate system used in (4)-(8) is shown, where x2 describes the aperture dimension, x1 describes the azimuthal location of the scatterer in the field, and z describes the axial dimension. xn and zn reference the nth scatterer, and zf is the receive beam’s focal depth. The elevation dimension is not shown in the figure but notation mirrors the lateral dimension.
Fig. 2
Fig. 2
Focused pressure wavefronts sampled by an array are shown for four different cases. In the case of the bright off-axis scatterer most of the energy will cancel when the elements are summed, but if a scatterer is sufficiently bright relative to the signal of interest image degradation will occur. The multipath reverberation case is more complicated because the wavefront sampled by the array is no longer stationary and summing across the array will rarely suppress as much energy as with a stationary sinusoid. The last figure shows the realistic scenario of a wavefront composed of all three scattering sources arriving at the transducer simultaneously.
Fig. 3
Fig. 3
Beam sensitivity for scatterers along the azimuthal dimension and the axial dimension are shown for 1.8 MHz beam focused at 5 cm with a 2 cm aperture. Beam sensitivity plots are shown for beams approximated based on the model in (8) and beams simulated using Field II. The azimuthal sensitivity charts the traditional narrowband beam plot. The axial sensitivity is significantly different and shows a much broader main lobe and overall less attenuation even at significant distances from the focus.
Fig. 4
Fig. 4
The flow chart provides an overview of the algorithm. Within the diagram references are made to the relevant equations in the text.
Fig. 5
Fig. 5
Graphs of contrast, CNR, and speckle SNR are shown. There is a clear improvement in the B-Mode contrast. The CNR results show little overall change. The speckle SNR is consistently lower in the decluttered data. Data from each patient are displayed with one of the colored shapes, which is kept consistent across all the scatter plots. The gray line shows equivalency between the normal and decluttered results.
Fig. 6
Fig. 6
B-Mode images are shown demonstrating the cases of the most (top) and least (bottom) improvement in contrast. In the top image pair the decluttered image shows significant improvements in contrast and may show some small new features not visible in the normal B-mode image. The images on the bottom show similar features without significant changes. The images are created with 70 dB and 60 dB of dynamic range on the top and bottom, respectively.
Fig. 7
Fig. 7
These image sets both show a human liver and gall bladder. Matched B-Mode and decluttered B-Mode images are shown for each clinical subject. The gall bladder is visible in the bottom of each image and a prominent vessel is visible in each image as well. In the second subject the decluttered image appears to show the bile duct coming from the gall bladder, which is not evident in the normal B-Mode image. All images are displayed with 65 dB dynamic range.
Fig. 8
Fig. 8
Histograms of phantom image magnitudes are shown for the original and decluttered data. The results show that the first order statistics are changed after decluttering. The histogram from all data sets are shown along with the mean histogram for each scenario.
Fig. 9
Fig. 9
Second order speckle statistics are shown in the axial and azimuthal dimensions for phantom data in regions of diffuse scattering. The second order statistics are consistent before and after decluttering the data. The mean correlations are displayed with the thick line and the standard deviations for each curve are displayed with the thinner line.

References

    1. Carson PL, Oughton TV. A modeled study for diagnosis of small anechoic masses with ultrasound. Radiology. 1977 Mar.122(no. 3):765–771. - PubMed
    1. Bly SHP, Foster FS, Patterson MS, Foster DR, Hunt JW. Artifactual Echoes in B-Mode Images due to Multiple Scattering. Ultrasound in Med. & Biol. 1985;11(no. 1):99–111. - PubMed
    1. Smith S, Trahey G, von Ramm O. Phased array ultrasound imaging through planar tissue layers. Ultrasound in Medicine & Biology. 1986;12(no. 3):229–243. - PubMed
    1. Mann JA, Walker W. A constrained adaptive beamformer for medical ultrasound: initial results. Ultrasonics Symposium: 2002. Proceedings 2002 IEEE. 2002;2:1807–1810. vol. 2.
    1. Tabei M, Mast TD, Waag RC. Simulation of ultrasonic focus aberration and correction through human tissue. J Acoust Soc Am. 2003;113(no. 2):1166–1176. - PubMed

Publication types