. 2014 Mar;124(3):1242-54.
doi: 10.1172/JCI72126. Epub 2014 Feb 24.

Cell-specific translational profiling in acute kidney injury

Cell-specific translational profiling in acute kidney injury

Jing Liu et al. J Clin Invest. 2014 Mar.

Erratum in

  • J Clin Invest. 2014 May 1;124(5):2288. Humphreys, Benjamin [corrected to Humphreys, Benjamin D]

Abstract

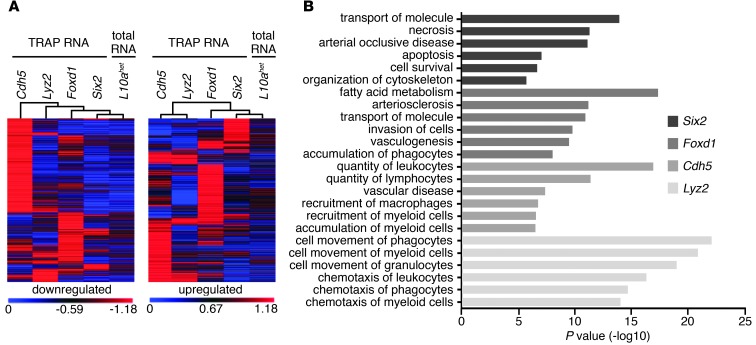
Acute kidney injury (AKI) promotes an abrupt loss of kidney function that results in substantial morbidity and mortality. Considerable effort has gone toward identification of diagnostic biomarkers and analysis of AKI-associated molecular events; however, most studies have adopted organ-wide approaches and have not elucidated the interplay among different cell types involved in AKI pathophysiology. To better characterize AKI-associated molecular and cellular events, we developed a mouse line that enables the identification of translational profiles in specific cell types. This strategy relies on CRE recombinase-dependent activation of an EGFP-tagged L10a ribosomal protein subunit, which allows translating ribosome affinity purification (TRAP) of mRNA populations in CRE-expressing cells. Combining this mouse line with cell type-specific CRE-driver lines, we identified distinct cellular responses in an ischemia reperfusion injury (IRI) model of AKI. Twenty-four hours following IRI, distinct translational signatures were identified in the nephron, kidney interstitial cell populations, vascular endothelium, and macrophages/monocytes. Furthermore, TRAP captured known IRI-associated markers, validating this approach. Biological function annotation, canonical pathway analysis, and in situ analysis of identified response genes provided insight into cell-specific injury signatures. Our study provides a deep, cell-based view of early injury-associated molecular events in AKI and documents a versatile, genetic tool to monitor cell-specific and temporal-specific biological processes in disease modeling.


Figures

Figure 1
Figure 1. Schematic of Rosa26-EGFP-L10a allele and experimental work flow.
The EGFP-L10a fusion protein was reversely integrated into the Rosa26 locus. Following CRE-mediated removal of the transcriptional stop cassette (3x pA), EGFP-L10a expression is driven by the CAGGS promoter. Four different Cre lines (Six2, Foxd1, Cdh5, and Lyz2) were used in this study to drive expression of the transgene in major cellular compartments of the kidney (renal tubules, interstitial cells, endothelial cells, and macrophages, respectively). RNA was isolated using TRAP prior to profiling via microarray.
Figure 2
Figure 2. Double immunofluorescence analysis with GFP and cell type–specific markers in untreated kidneys of 4 different Cre-L10a and L10a mice.
(AG) Representative images of GFP immunostaining (green) combined with cell type–specific antibodies (red): (B) LTL for proximal tubules, (C and G) PDGFRβ for interstitial cells (C) and mesangial cells (G), (D) F4/80 for macrophages, (E) WT1 for podocytes, and (F) PECAM1 for endothelial cells. Nuclei are stained with Hoechst (blue) in all images. Scale bars: 500 μm (A), 100 μm (B), 50 μm (CG).
Figure 3
Figure 3. Cell-specific signatures and DAVID GO Biological Process analysis for 4 kidney TRAP populations.
(A) Heat map showing relative gene expression value for enriched gene sets identified from 4 Cre-L10a populations (Six2, Foxd1, Cdh5, and Lyz2) of untreated kidneys. Color scale represents the relative gene expression value for each gene on each row across all 4 populations. (B) Histogram of TRAP microarray profiles (mean + SEM) across all 4 Cre-L10a populations for Slc22a12, Pdgfrb, Flt1, and Mpeg1: specific markers for nephron, interstitial cells, endothelial cells, and macrophages, respectively. (C) Top terms derived from DAVID GO Biological Process analysis for each of the 4 Cre-L10a-labeled cell populations isolated from untreated kidneys.
Figure 4
Figure 4. Cell type–specific IRI responses identified through TRAP analysis.
(A) Heat map showing hierarchical clustering of 3,180 DE genes identified from at least 1 of the 4 Cre-L10a populations 24 hours after IRI compared with sham treatment. Genes with a probe intensity of more than 500 and log2 fold change of more than 1 or less than –1 were included. Total RNA microarray data from mice heterozygous for the L10a allele (L10ahet) are displayed for comparison. Color scale indicates relative gene expression value. (B) Comparison of the number of DE genes identified from TRAP RNA versus total RNA microarray. The percentage of genes that showed significant changes in TRAP RNA, but not in total RNA samples, are listed.
Figure 5
Figure 5. Hierarchical clustering and ingenuity biological function analysis of DE genes.
(A) Heat maps displaying hierarchical clustering of DE genes (IRI vs. sham; left: downregulated, right: upregulated) identified from TRAP data sets (not in total RNA) from 4 Cre-L10a populations. Total RNA microarray data for mice heterozygous for the L10a allele (L10ahet) are displayed for comparison. Color scale indicates relative log2 ratio (IRI vs. sham). (B) Top terms derived from ingenuity biological functional analysis comparing DE genes (IRI vs. sham) for each of the 4 different Cre-L10a populations.
Figure 6
Figure 6. Canonical pathway analysis.
Unique and shared canonical pathways overrepresented within the 4 different Cre-L10a populations. Comparison of Ingenuity Canonical Pathway analysis was done using DE gene lists (IRI vs. sham) identified from the different Cre-L10a populations.
Figure 7
Figure 7. Visualization of expression patterns of cell type–specific IRI-responsive genes by RNA in situ hybridization.
(A) Histograms of microarray probe intensities (mean + SEM) of cell type–specific IRI-responsive genes across 4 different Cre-L10a populations and (B) their respective expression patterns in sham-operated and IRI kidneys visualized by RNA in situ hybridization. Scale bars: 200 μm (left and middle columns); ingenuity canonical pathway 50 μm (right column).
Figure 8
Figure 8. Validation of cell type–specific expression of IRI-responsive genes identified from Six2-L10a and Foxd1-L10a data sets.
(A) Cldn1 RNA in situ hybridization coupled with immunofluorescent staining for LTL confirms induction of Cldn1 (arrows) in LTL-positive proximal tubules in IRI-treated kidneys. Nuclei are stained with Hoechst (blue; middle column). (B) RNA in situ hybridization on consecutive sections demonstrates expression of Timp1 in Pdgfrb-positive interstitial cells (arrows) after IRI treatment. Scale bars: 75 μm.
Figure 9
Figure 9. Validation of cell type–specific expression of IRI-responsive genes identified from Cdh5-L10a and Lyz2-L10a data sets.
(A) RNA in situ hybridization for Inhbb (top) and Foxf1a (bottom) coupled with immunostaining (IHC) for PECAM1 on consecutive sections confirms induction in endothelial cells (arrows) after IRI treatment. (B) RNA in situ hybridization for Ppbp coupled with immunostaining for F4/80 (top) and LY-6G (bottom) on consecutive sections showed no overlap with the F4/80-positive macrophage population, but revealed colabeling with LY-6G antibody, a marker for monocytes and neutrophils (arrows). Scale bars: 75 μm.

References

    1. Warnock DG. Towards a definition and classification of acute kidney injury. J Am Soc Nephrol. 2005;16(11):3149–3150. doi: 10.1681/ASN.2005090934. - DOI - PubMed
    1. Waikar SS, Liu KD, Chertow GM. Diagnosis, epidemiology outcomes of acute kidney injury. Clin J Am Soc Nephrol. 2008;3(3):844–861. doi: 10.2215/CJN.05191107. - DOI - PubMed
    1. Shusterman N, Strom BL, Murray TG, Morrison G, West SL, Maislin G. Risk factors and outcome of hospital-acquired acute renal failure. Clinical epidemiologic study. Am J Med. 1987;83(1):65–71. - PubMed
    1. Chertow GM, Burdick E, Honour M, Bonventre JV, Bates DW. Acute kidney injury, mortality, length of stay, and costs in hospitalized patients. J Am Soc Nephrol. 2005;16(11):3365–3370. doi: 10.1681/ASN.2004090740. - DOI - PubMed
    1. Devarajan P. Update on mechanisms of ischemic acute kidney injury. J Am Soc Nephrol. 2006;17(6):1503–1520. doi: 10.1681/ASN.2006010017. - DOI - PubMed

Publication types

MeSH terms

Substances