. 2014 Mar;124(3):1382-92.
doi: 10.1172/JCI72181. Epub 2014 Feb 24.

Macrophages are required for neonatal heart regeneration

Macrophages are required for neonatal heart regeneration

Arin B Aurora et al. J Clin Invest. 2014 Mar.

Abstract

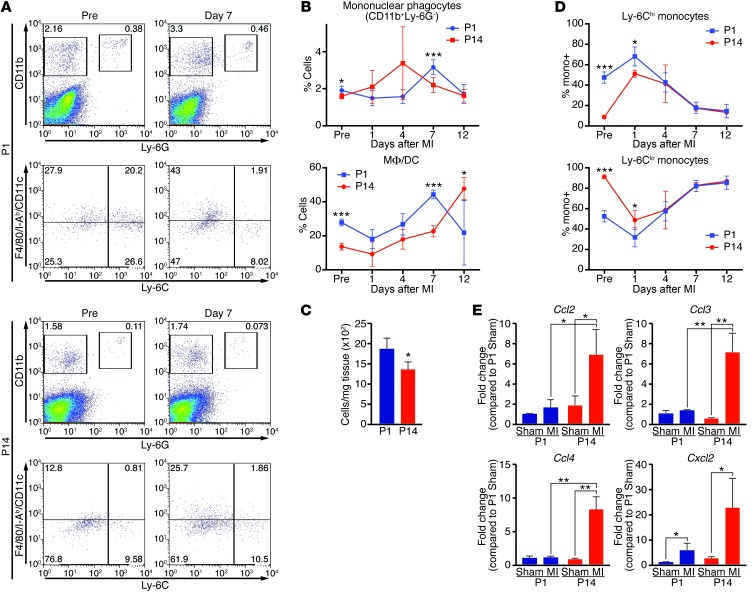
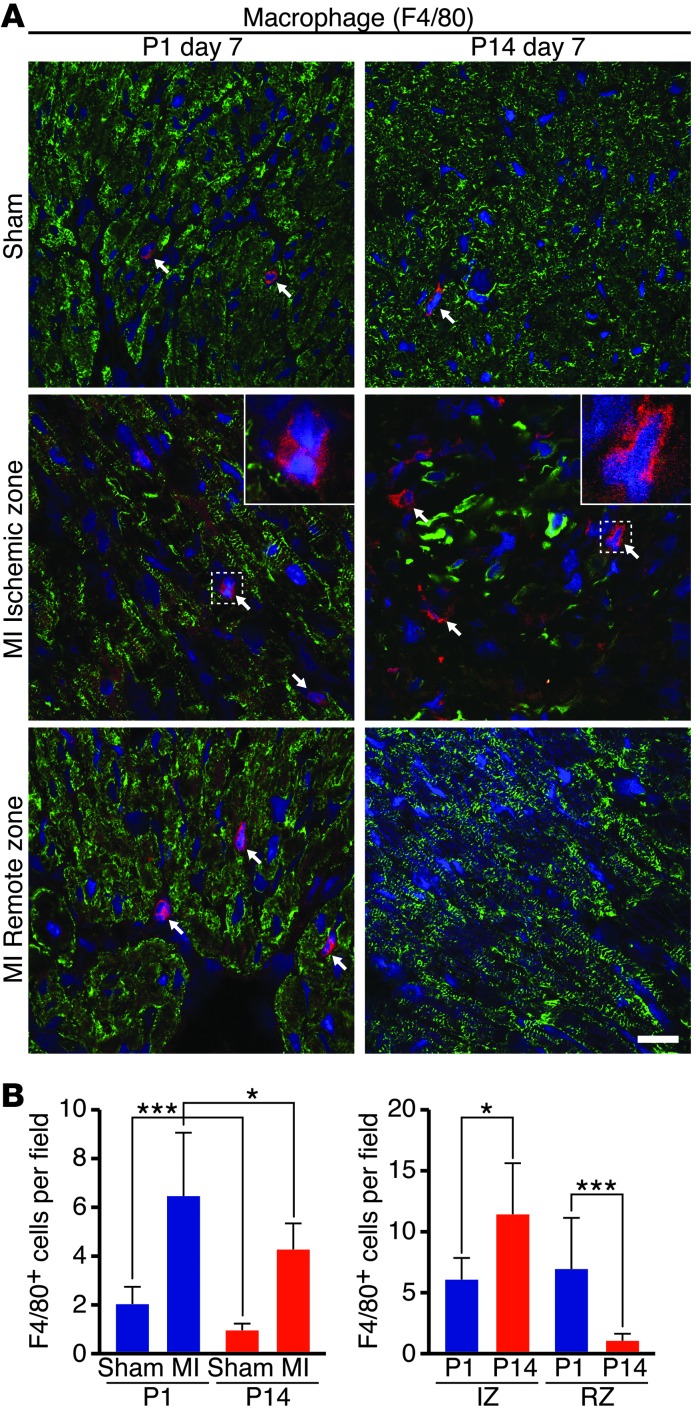
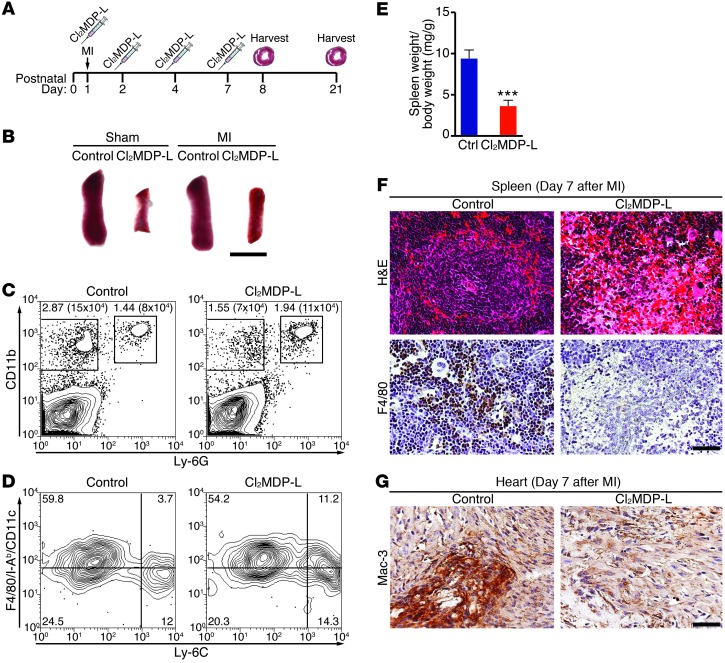
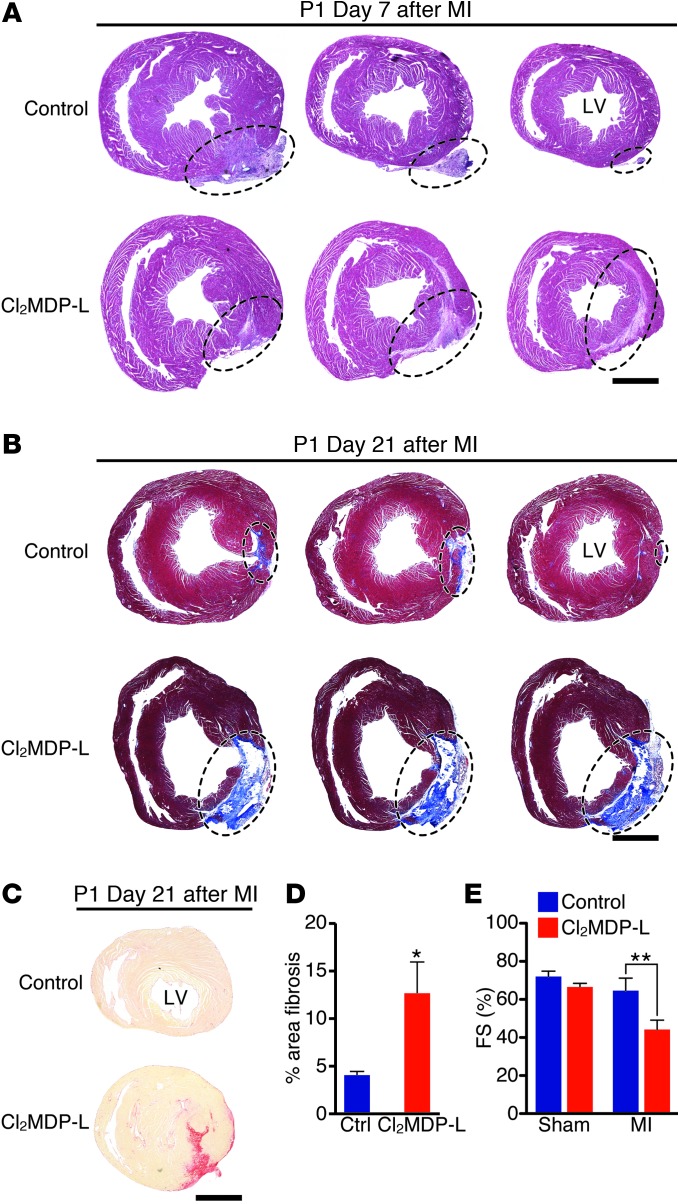
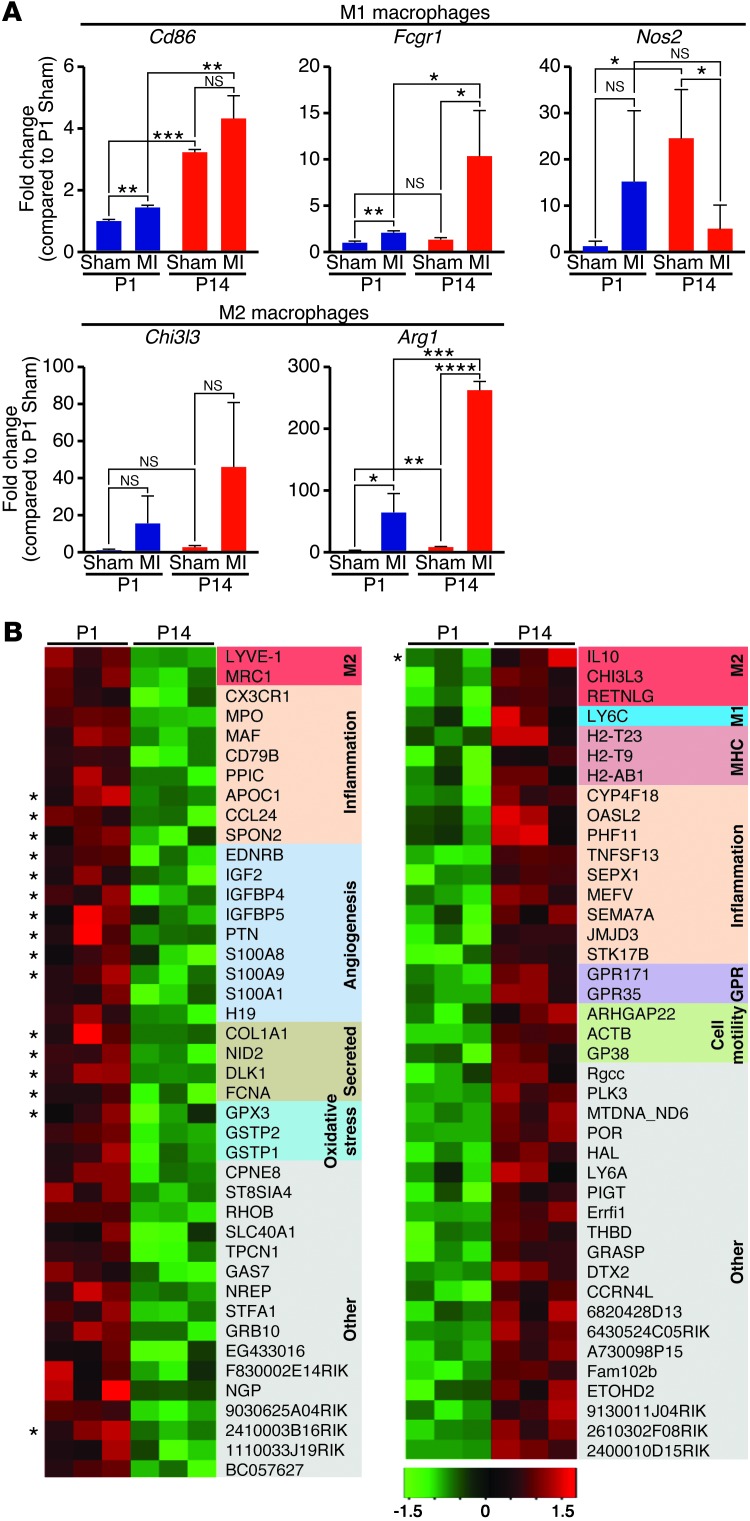
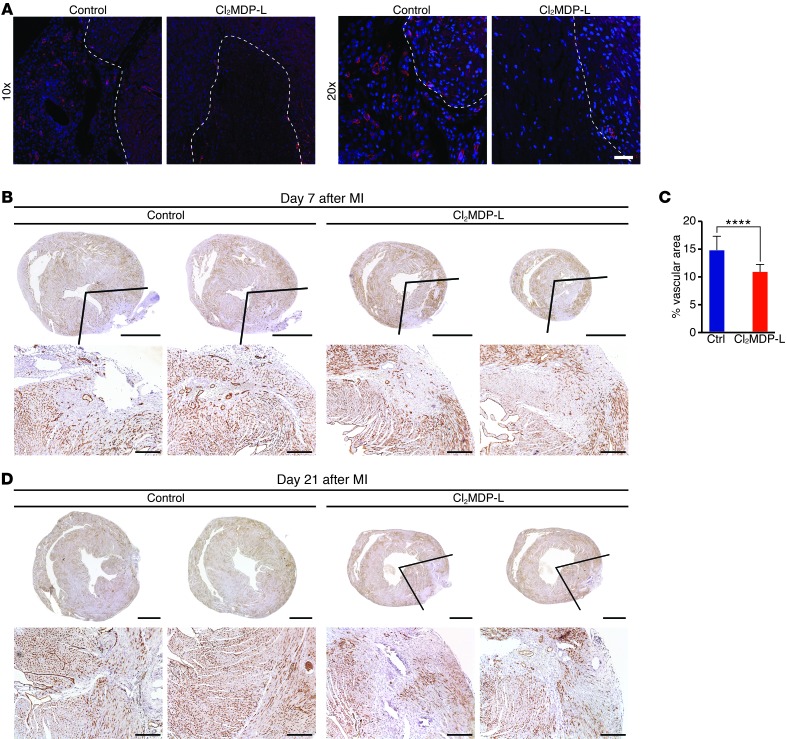
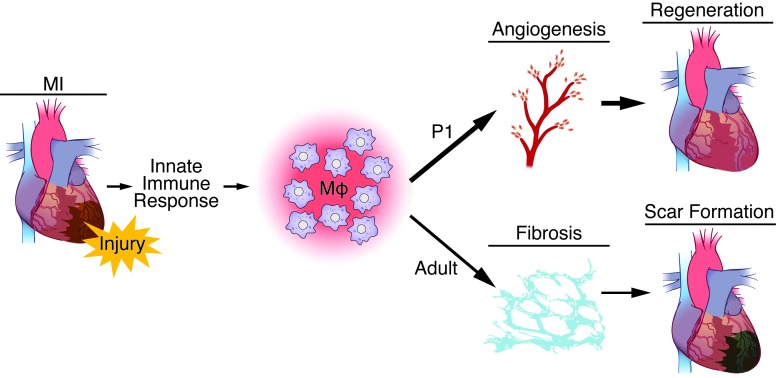
Myocardial infarction (MI) leads to cardiomyocyte death, which triggers an immune response that clears debris and restores tissue integrity. In the adult heart, the immune system facilitates scar formation, which repairs the damaged myocardium but compromises cardiac function. In neonatal mice, the heart can regenerate fully without scarring following MI; however, this regenerative capacity is lost by P7. The signals that govern neonatal heart regeneration are unknown. By comparing the immune response to MI in mice at P1 and P14, we identified differences in the magnitude and kinetics of monocyte and macrophage responses to injury. Using a cell-depletion model, we determined that heart regeneration and neoangiogenesis following MI depends on neonatal macrophages. Neonates depleted of macrophages were unable to regenerate myocardia and formed fibrotic scars, resulting in reduced cardiac function and angiogenesis. Immunophenotyping and gene expression profiling of cardiac macrophages from regenerating and nonregenerating hearts indicated that regenerative macrophages have a unique polarization phenotype and secrete numerous soluble factors that may facilitate the formation of new myocardium. Our findings suggest that macrophages provide necessary signals to drive angiogenesis and regeneration of the neonatal mouse heart. Modulating inflammation may provide a key therapeutic strategy to support heart regeneration.


Figures

Figure 1
Figure 1. Mononuclear phagocytes respond differently to MI in P1 and P14 mice.
(A) Single cell suspensions isolated from hearts of mice before MI (Pre) or 7 days following MI at P1 or P14 were stained with anti-CD11b, –Ly-6G, –Ly-6C, -F4/80, -CD11c, –I-Ab mAbs and analyzed by FACS. Mononuclear phagocytes were identified as CD11b+Ly-6G and neutrophils were identified as CD11b+Ly-6G+ (top panels). Within the mononuclear phagocyte population, macrophages/DCs are classified as (F4/80/CD11c/I-Ab)hiLy-6Clo and monocytes are depicted as (F4/80/CD11c/I-Ab)loLy-6Chi or (F4/80/CD11c/I-Ab)loLy-6Clo (bottom panels). Percentages of cells are indicated for the representative dot plots. (B) Quantification at the indicated time points to compare the percentage of all mononuclear phagocytes or macrophages/DCs (MΦ/DCs) relative to the leukocyte-enriched gate or mononuclear phagocyte population, respectively, in mice undergoing MI at P1 (blue) or P14 (red) (n = 3–5 per time point). (C) Total number of mononuclear phagocytes per milligram of heart tissue 7 days after MI at P1 or P14. (D) Relative percentages of Ly-6Chi and Ly-6Clo monocytes in the heart were quantified over time following MI of mice at P1 or P14 (n = 3–5 per time point). (E) Real-time RT-PCR analysis of cardiac chemokine expression at 3 days following MI of P1 or P14 mice. Expression is relative to that in P1 sham-operated mice [P1 Sham]) (n = 3). Data are mean ± SEM. *P < 0.05, **P < 0.01, ***P < 0.001.
Figure 2
Figure 2. Macrophage abundance and localization in hearts following MI of P1 or P14 mice.
(A) Heart sections were stained with anti-F4/80 (red) to visualize macrophages in sham-operated (Sham) P1 or P14 mice or in the IZ or RZ of hearts 7 days following MI. Myocardium is labeled with desmin (green), and nuclei are visualized with Hoechst (blue). Arrows point to F4/80+ macrophages. Insets shows high-magnification images of F4/80+ cells. Scale bar: 20 μm. (B) The total number of F4/80+ macrophages 7 days following MI or sham surgery was quantified on 3 serial sections per heart starting at suture level (or plane of suture for sham-operated mice) and progressing toward the apex (n = 3–4 mice per group). The P1 group had more total macrophages than the P14 group in the absence of injury (Sham) and after MI. The number of F4/80+ macrophages was also compared within the IZ or RZ to reveal localization differences. Data represent mean ± SEM. *P < 0.05, ***P < 0.001.
Figure 3
Figure 3. Depletion of monocytes/macrophages in a model of neonatal heart regeneration.
(A) Experimental strategy to deplete monocytes/macrophages using clodronate liposomes (Cl2MDP-L) following MI at P1. (B) Spleens harvested from control or monocyte/macrophage-depleted mice 3 days following sham or MI surgeries are shown. Scale bar: 4 mm. (C) Contour plots from mice 3 days after MI depict mononuclear phagocyte and neutrophil percentages and numbers in hearts after depleting with Cl2MDP-L or injection of saline (control). (D) Mononuclear phagocytes were further specified as Ly-6Chi monocytes (bottom right), Ly-6Clo monocytes (bottom left), and macrophages/DCs (top left). (E) By 7 days after MI, spleens weigh significantly less in Cl2MDP-L–treated neonates compared with those in control mice. Data represent mean ± SEM. ***P < 0.0001. (F) H&E-stained sections of the spleen and immunohistochemistry with F4/80 show that Cl2MDP-L–treated mice have been depleted of monocytes/macrophages 7 days following MI. Scale bar: 40 μm. (G) Immunohistochemical staining for Mac-3 depicts monocyte/macrophage depletion in the IZ of heart sections from Cl2MDP-L–treated mice compared to control mice. Scale bar: 40 μm.
Figure 4
Figure 4. Depletion of monocytes/macrophages blocks heart regeneration in neonatal mice.
(A) At 7 days after MI, H&E-stained serial heart sections, starting below the ligature and progressing toward the apex (3 sections per heart), show a diminishing infarct area that has been displaced to the periphery in control mice. Cl2MDP-L–treated mice maintain an interstitial scar. The injured area is circled. Scale bar: 1 mm. (B) Masson’s trichrome staining of serial sections, starting below the ligature and progressing toward the apex, from control or Cl2MDP-L–treated mice 21 days following MI at P1 to visualize fibrosis. The injured area is circled. Scale bar: 1 mm. (C and D) Picrosirius red staining on heart sections from control or Cl2MDP-L–treated mice 21 days following MI at P1. (C) Representative images and (D) quantification as a percentage of total section area (≥7 sections per heart) show significantly more fibrosis in the Cl2MDP-L–treated group (n = 7–8 mice per group). Scale bar: 1 mm. (E) Cardiac function following MI or sham surgeries was assessed at 28 days after MI by echocardiography. Data are expressed as the percentage of FS (n = 3–4 mice per group). Data are mean ± SEM. *P < 0.05, **P < 0.01.
Figure 5
Figure 5. Macrophage immunophenotyping in P1 and P14 mice.
(A) Real-time qPCR analysis of M1 and M2 macrophage genes in hearts from mice 3 days after sham surgery or MI at P1 or P14 (n = 3). Data represent mean ± SEM. *P < 0.05, **P < 0.01, ***P < 0.001, ****P < 0.0001. (B) Expression profiling during the macrophage response to MI in P1 or P14 mice identified multiple genes that are differentially expressed in purified cardiac macrophages. The heat map shows mRNAs changed 2-fold or greater (P < 0.01) between P1 and P14 cardiac macrophages 3 days following MI. Red indicates upregulated genes whereas green indicates downregulated genes. Functional groups of regulated genes are color coded, and soluble factors are indicated by asterisks.
Figure 6
Figure 6. Angiogenesis is impaired in monocyte/macrophage-depleted neonates following MI.
(A) Sections from control or Cl2MDP-L–treated hearts stained with PECAM (red) and Hoechst (blue) to label endothelial cells and nuclei, respectively, 7 days after MI. Vessels are visible in infarct areas (marked by dashed lines) in controls but not in the Cl2MDP-L group. Original magnification, ×10 (top row); ×20 (bottom row). (BD) The vasculature was visualized by endomucin immunohistochemistry (brown) on serial heart sections starting below the ligature and progressing toward the apex of control and Cl2MDP-L–treated neonates at (B) 7 and (D) 21 days after MI. (B) Two serial heart sections for each mouse show newly forming vessels invading the IZ in control but not Cl2MDP-L–treated neonates, and lines indicate area used to quantify vessel density. (C) Significantly fewer neovessels are present in Cl2MDP-L–treated mice compared with controls. Data are mean ± SEM. ****P < 0.0001. (D) At 21 days after MI, control mice have new myocardia that contain abundant endomucin-positive vasculature, while heart sections from Cl2MDP-L–treated mice contain areas devoid of new vessels. Lines indicate area lacking vessels. Scale bars: 1 mm (top rows); 200 μm (bottom rows).
Figure 7
Figure 7. Model demonstrating the dual role of macrophages in regeneration (as in P1 mice) or scar formation (as in adult mice) following MI.
Following MI, the innate immune response to cardiac injury involves activation and recruitment of macrophages in the heart, in which they function to clear cellular debris and secrete soluble factors. Macrophage populations promote regenerative processes, such as angiogenesis, in P1 mice, while work done previously in adult mice shows they mediate fibrosis and other aspects of scar formation.

Comment in

References

    1. Minino AM, Murphy SL, Xu J, Kochanek KD. Deaths: final data for 2008. Natl Vital Stat Rep. 2011;59(10):1–126. - PubMed
    1. Porrello ER, et al. Transient regenerative potential of the neonatal mouse heart. Science. 2011;331(6020):1078–1080. doi: 10.1126/science.1200708. - DOI - PMC - PubMed
    1. Porrello ER, et al. Regulation of neonatal and adult mammalian heart regeneration by the miR-15 family. Proc Natl Acad Sci U S A. 2013;110(1):187–192. doi: 10.1073/pnas.1208863110. - DOI - PMC - PubMed
    1. Mahmoud AI, Porrello ER. Turning back the cardiac regenerative clock: lessons from the neonate. Trends Cardiovasc Med. 2012;22(5):128–133. doi: 10.1016/j.tcm.2012.07.008. - DOI - PubMed
    1. Walsh S, Pontén A, Fleischmann BK, Jovinge S. Cardiomyocyte cell cycle control and growth estimation in vivo — an analysis based on cardiomyocyte nuclei. Cardiovasc Res. 2010. 86 3 365 -373. 10.1093/cvr/cvq005 - DOI - PubMed

Publication types

Associated data