. 2014 Apr;124(4):1794-809.
doi: 10.1172/JCI69927. Epub 2014 Feb 24.

Hematopoiesis and RAS-driven myeloid leukemia differentially require PI3K isoform p110α

Hematopoiesis and RAS-driven myeloid leukemia differentially require PI3K isoform p110α

Kira Gritsman et al. J Clin Invest. 2014 Apr.

Abstract

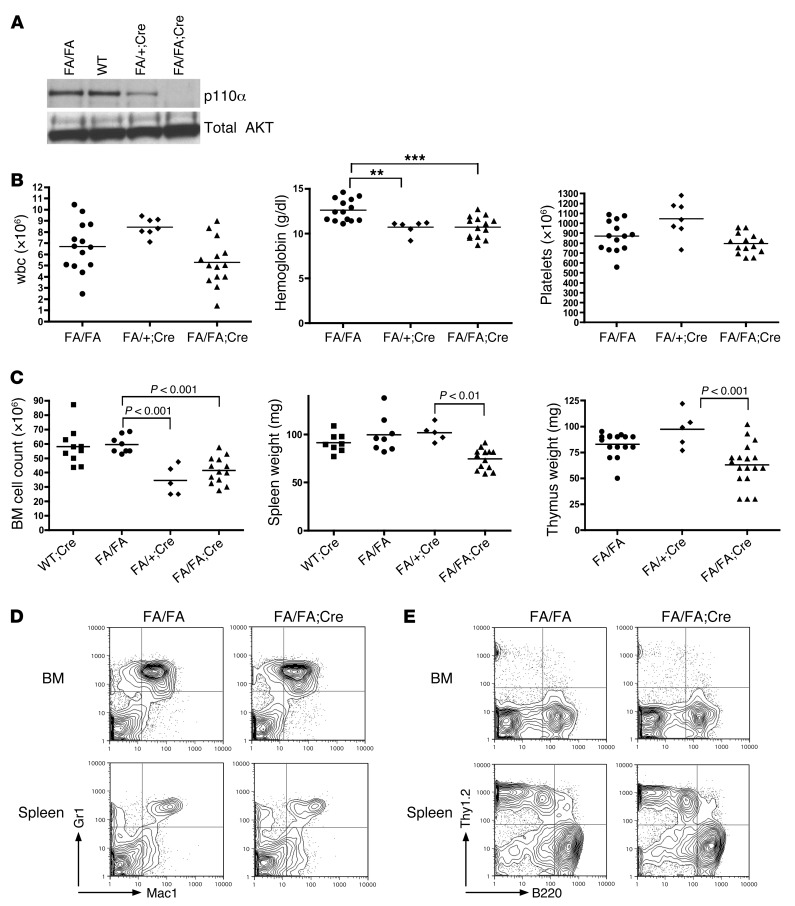
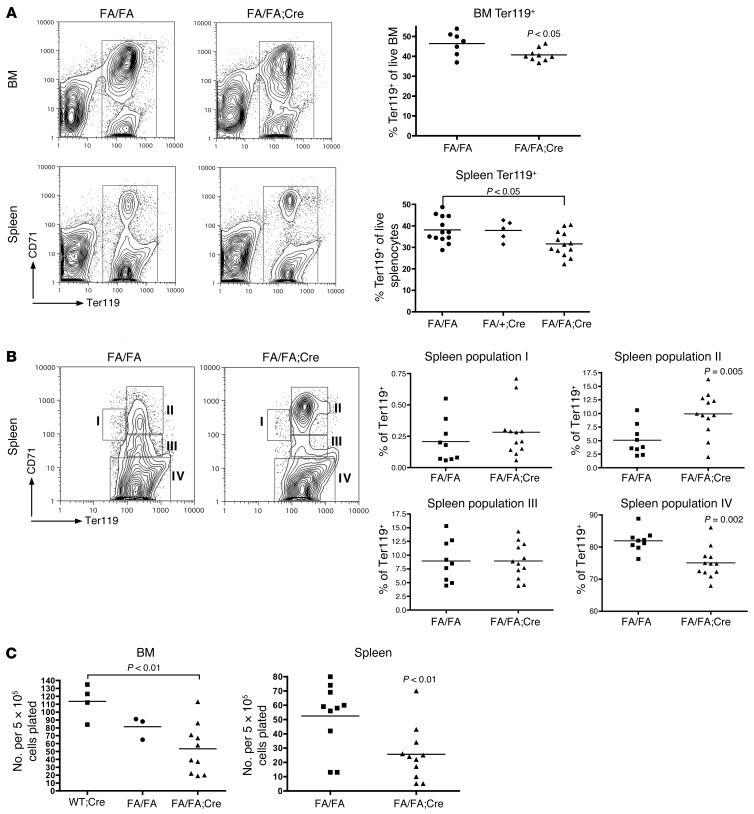
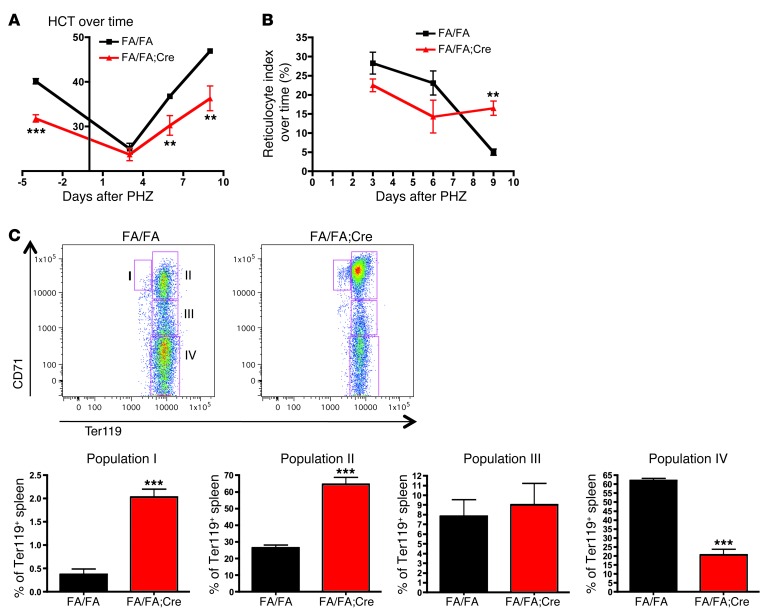
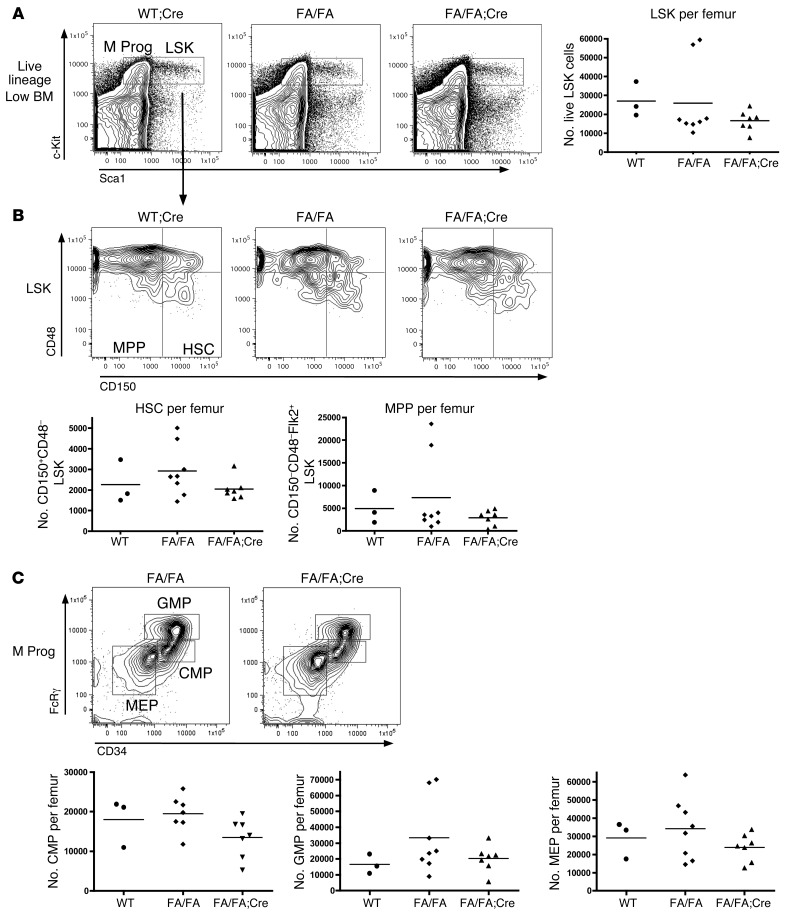
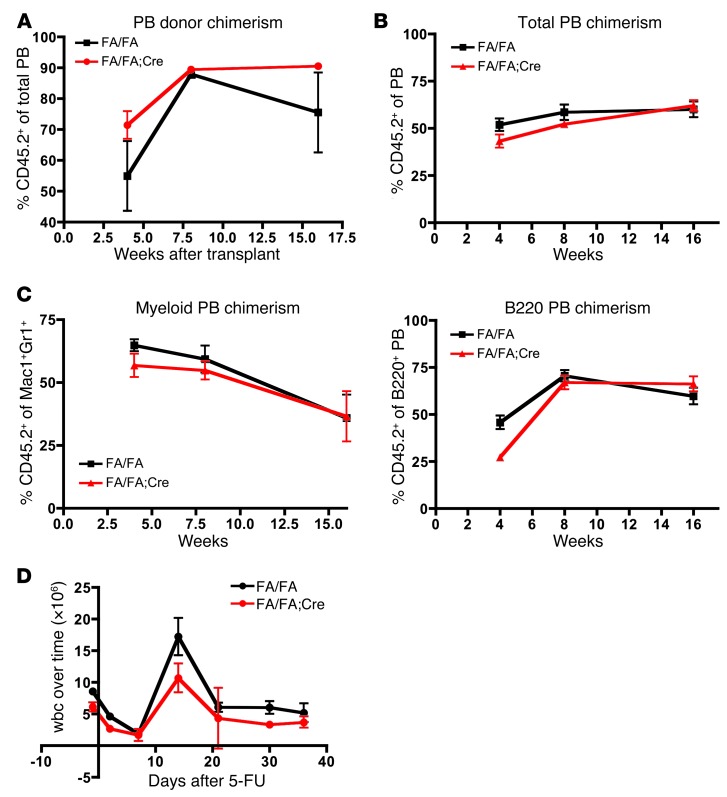
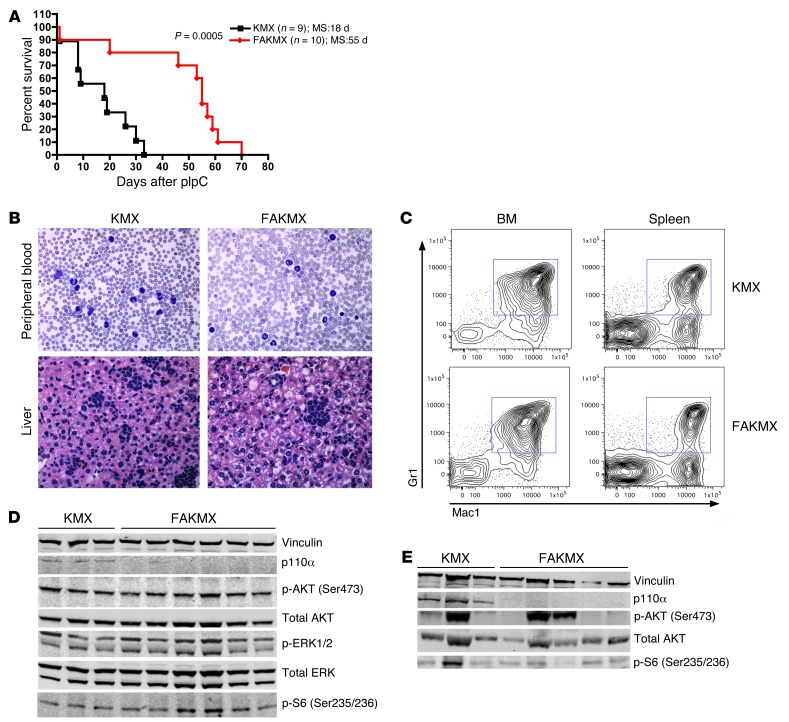
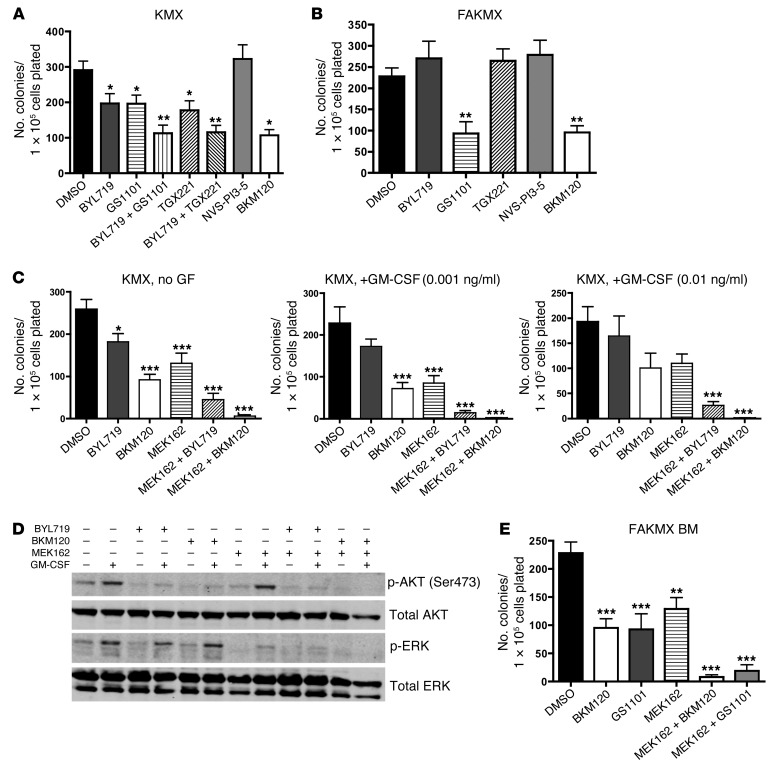
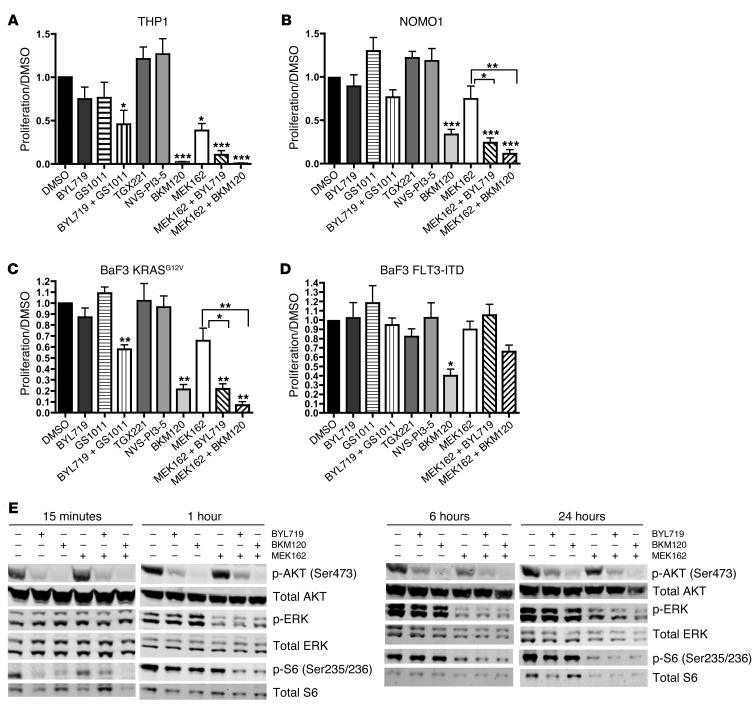
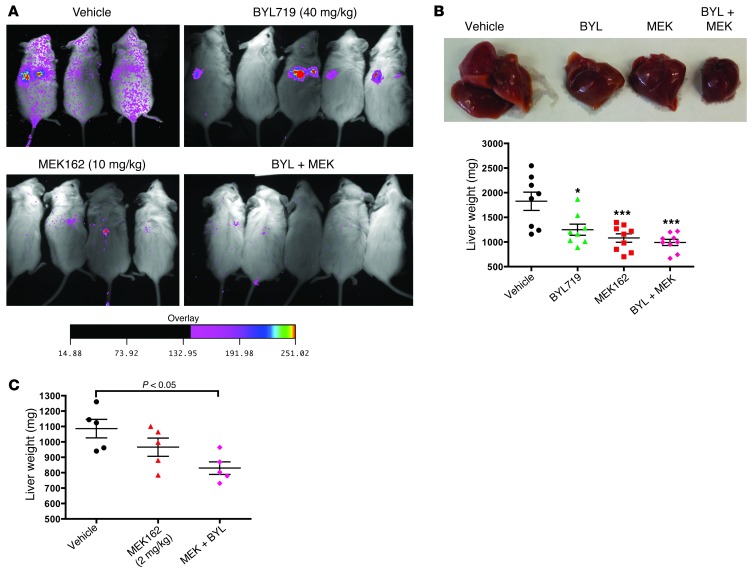
The genes encoding RAS family members are frequently mutated in juvenile myelomonocytic leukemia (JMML) and acute myeloid leukemia (AML). RAS proteins are difficult to target pharmacologically; therefore, targeting the downstream PI3K and RAF/MEK/ERK pathways represents a promising approach to treat RAS-addicted tumors. The p110α isoform of PI3K (encoded by Pik3ca) is an essential effector of oncogenic KRAS in murine lung tumors, but it is unknown whether p110α contributes to leukemia. To specifically examine the role of p110α in murine hematopoiesis and in leukemia, we conditionally deleted p110α in HSCs using the Cre-loxP system. Postnatal deletion of p110α resulted in mild anemia without affecting HSC self-renewal; however, deletion of p110α in mice with KRASG12D-associated JMML markedly delayed their death. Furthermore, the p110α-selective inhibitor BYL719 inhibited growth factor-independent KRASG12D BM colony formation and sensitized cells to a low dose of the MEK inhibitor MEK162. Furthermore, combined inhibition of p110α and MEK effectively reduced proliferation of RAS-mutated AML cell lines and disease in an AML murine xenograft model. Together, our data indicate that RAS-mutated myeloid leukemias are dependent on the PI3K isoform p110α, and combined pharmacologic inhibition of p110α and MEK could be an effective therapeutic strategy for JMML and AML.


Figures

Figure 1
Figure 1. HSC-specific deletion of p110α has minimal effects on hematopoiesis.
(A) Western blot analysis of BM lysates from mice treated with pIpC and sacrificed after 4 weeks. Lanes were run on the same gel but were noncontiguous. (B) PB cell counts obtained from FA/FA;Cre mice and FA/FA and FA/+;Cre littermate controls treated with pIpC at 4 weeks of age and analyzed 3 weeks later. **P < 0.005, ***P < 0.001, 1-way ANOVA with Tukey post-test. (C) BM cell counts from 2 femurs and 2 tibia, spleen weights, and thymus weights of FA/FA;Cre mice, FA/FA and FA/+;Cre littermate controls, and age-matched WT;Cre controls sacrificed 4 weeks after pIpC treatment. 1-way ANOVA with Tukey post-test was used to compare groups. (D and E) Representative flow cytometry plots of BM and spleen single-cell suspensions from FA/FA;Cre mice and FA/FA littermate controls sacrificed 4 weeks after pIpC treatment. See Supplemental Figure 1 for dot plots of individual data for each cell population.
Figure 2
Figure 2. Deletion of p110α impairs erythroblast differentiation.
(A) Representative flow cytometry plots of BM and spleen single-cell suspensions prepared without rbc lysis 4 weeks after pIpC treatment. Dot plots of individual data are also shown. 2 tailed Student’s t test (BM) or 1-way ANOVA with Tukey post-test (spleen) was used for analysis. (B) The Ter119+ gate was further subdivided into stages I–IV of erythroblast maturation, and the frequency of each cell population in splenocytes was quantified. Representative flow cytometry plots and dot plots of individual data are shown. 2-tailed Student’s t test was used to compare groups. (C) BFU-E colony assays in M3334 methylcellulose media of BM and spleen cells. BFU-E colonies were scored 7 days after plating. Data represent a composite of 3 separate experiments. 1-way ANOVA with Tukey post-test (BM) or 2-tailed Student’s t test (spleen) was used for analysis.
Figure 3
Figure 3. FA/FA;Cre mice have a sluggish response to erythroid stress after PHZ administration.
(A) 6 FA/FA mice and 4 FA/FA;Cre mice were injected with PHZ (30 mg/kg s.c.) on 2 consecutive days. PB was obtained before and 3, 6, and 9 days after the first injection. The experiment was performed twice. (B) Reticulocyte count was determined using methylene blue staining, and the reticulocyte index was calculated (assuming a normal HCT of 45%) as reticulocyte count (%) × (HCT/45) and expressed as a percentage. (C) Amplified block in erythroblast maturation in the spleen after PHZ injection. Spleens from PHZ-treated mice were harvested on day 9 after the first injection, subjected to staining with Ter119 and CD71, and analyzed using FACSCalibur. The Ter119+ gate was further subdivided into stages I–IV of erythroblast maturation, and the frequency of each cell population in splenocytes was quantified. Representative flow cytometry plots and bar graphs of the individual data are shown. **P < 0.005, ***P < 0.001, 2-tailed Student’s t test.
Figure 4
Figure 4. Deletion of p110α does not affect the number of HSCs or myeloid progenitors in the BM.
BM was stained with a lineage cocktail of antibodies and with antibodies recognizing Sca1, c-Kit, CD150, CD48, and Flk2. (A) Representative flow plots gated on the live lineage-low gate, with LSK and LinSca1c-Kit+ myeloid progenitor (M Prog) populations indicated. Dot plot showing absolute number of LSK cells per femur is also shown. (B) Representative flow plots gated on LSK cells, with CD150+CD48 HSC and CD150CD48 MPP populations indicated. Dot plots showing absolute number of HSCs and MPPs per femur are also shown. (C) Representative flow plots, gated on the myeloid progenitor gate, with CMP, GMP, and MEP subpopulations indicated. Dot plots showing absolute numbers of cells per femur are also shown. All statistical analyses were performed using 1-way ANOVA with Tukey post-test.
Figure 5
Figure 5. p110α is not essential for HSC self-renewal or for stress hematopoiesis.
(A) Noncompetitive repopulation of BM from pIpC-treated FA/FA;Cre mice or FA/FA littermate controls. PB was collected from transplant recipients at 4, 8, and 16 weeks after transplantation, and donor chimerism was determined by flow cytometry as the frequency of CD45.2+ donor-derived cells. (B) Competitive repopulation using BM from pIpC-treated FA/FA;Cre mice or FA/FA littermate controls, mixed in a 3:1 ratio with competitor BM from WT F1 C57BL/6×B6.SJL mice and injected into lethally irradiated B6.SJL recipients. Donor chimerism was determined as in A. (C) Donor contribution to the Mac1+Gr1+ myeloid and B220+ B cell populations in the PB in competitive repopulation experiments. (D) 5-fluorouracil administration to pIpC-treated FA/FA;Cre mice and FA/FA littermate controls. Statistical analyses were performed using 2-tailed Student’s t test. Experiments were performed twice.
Figure 6
Figure 6. KRASG12D in a murine model of JMML is dependent upon p110α.
(A) Kaplan-Meier survival curves of FAKMX mice and KMX controls after 1 dose of pIpC (100 μg) at 4 weeks of age. MS, median survival. The log-rank test was used to compare survival between groups. (B) Representative blood smears and liver histology sections from moribund FAKMX mice and KMX controls at the time of sacrifice. Original magnification, ×60. (C) Representative flow cytometry plots of BM and spleen cells from moribund FAKMX mice and KMX controls stained with Mac1 and Gr1 antibodies. (D) Western blot analysis of BM lysates from FAKMX mice and KMX controls sacrificed 9 days after pIpC treatment. The same membrane was stripped and incubated with anti-AKT and anti-ERK antibodies. (E) Western blot analysis of BM lysates from moribund FAKMX mice and KMX controls. The membrane was stripped and incubated with anti-AKT antibody. Lanes were run on the same gel but were noncontiguous. See Supplemental Figure 3, A and B, for quantification of signal intensities.
Figure 7
Figure 7. A combination of PI3K and MEK inhibitors reduces myeloid colony formation by KMX BM.
(AC and E) Number of total colonies observed 7 days after plating 1 × 10⁵ BM cells from pIpC-treated KMX (A and C) or FAKMX mice (B and E) in M3231 growth factor–free methylcellulose media. The final concentration of each inhibitor in methylcellulose is as follows: BYL719, 1 μM; GS1101, 1 μM; TGX221, 1 μM; BKM120, 1 μM; NVS-PI3-5, 100 nM; MEK162, 100 nM. PI3K inhibitors were used at the highest dose at which isoform selectivity could be expected for each. Each experiment was performed 3 times. *P < 0.05, **P < 0.01, ***P < 0.001, 1-way ANOVA with Bonferroni multiple-comparison post-test. (D) Freshly harvested KMX BM cells were cultured for 1 hour in the presence of the same inhibitors, stimulated with 1 ng/ml GM-CSF for 5 minutes, lysed, and subjected to Western blotting. Lanes were run on the same gel but were noncontiguous. The experiment was performed 3 times. The membrane was stripped and incubated with anti-AKT and anti-ERK antibodies. See Supplemental Figure 5B for quantification of signal intensities.
Figure 8
Figure 8. A combination of PI3K and MEK inhibitors blocks proliferation and AKT and MAPK signaling in RAS-mutated AML cell lines.
(AD) 72-hour MTS proliferation assays. To calculate proliferation, each absorbance value was divided by the mean absorbance of DMSO-treated cells. The concentration of each inhibitor used is as follows: BYL719, 1 μM; GS1101, 1 μM; TGX221, 1 μM; BKM120, 1 μM; NVS-PI3-5, 100 nM; MEK162, 25 nM. Each experiment was performed 3 times. *P < 0.05, **P < 0.01, ***P < 0.001, 1-way ANOVA with Dunnett multiple-comparison test (vs. DMSO control) or with Tukey post-test (as denoted by brackets). (E) Western blot analysis of AKT and MAPK signaling in THP1 cells after drug treatment for the indicated times, at the concentrations listed above. The same membrane was stripped and incubated with anti-AKT, anti-ERK, and anti-S6 antibodies. Lanes were run on the same gel but were noncontiguous. Each experiment was performed 3 times. See Supplemental Figure 10 for quantification of signal intensities.
Figure 9
Figure 9. BYL719 and MEK162 reduce disease burden in a THP1 murine xenograft AML model.
(A) Bioluminescence imaging of mice 12 days after injection with 4.5 × 10⁶ THP1-luciferase cells, 7 days after the initiation of drug treatment. The intensity scale of the bioluminescence signal applies to all images. (B) Liver weights of THP1 xenografted mice 11 days after initiation of treatment with 40 mg/kg/d BYL719, 10 mg/kg/d MEK162, or the combination. (C) Liver weights of mice xenografted with 4.5 × 10⁶ THP1 cells, then treated for 11 days with vehicle or low-dose MEK162 (2 mg/kg/d), alone or in combination with 40 mg/kg/d BYL719. *P < 0.05, ***P < 0.001, 1-way ANOVA with Bonferroni multiple-comparison post-test.

References

    1. Polak R, Buitenhuis M. The PI3K/PKB signaling module as key regulator of hematopoiesis: implications for therapeutic strategies in leukemia. Blood. 2012;119(4):911–923. doi: 10.1182/blood-2011-07-366203. - DOI - PubMed
    1. Vanhaesebroeck B, Ali K, Bilancio A, Geering B, Foukas LC. Signalling by PI3K isoforms: insights from gene-targeted mice. Trends Biochem Sci. 2005;30(4):194–204. doi: 10.1016/j.tibs.2005.02.008. - DOI - PubMed
    1. Manning BD, Cantley LC. AKT/PKB signaling: navigating downstream. Cell. 2007;129(7):1261–1274. doi: 10.1016/j.cell.2007.06.009. - DOI - PMC - PubMed
    1. Samuels Y, et al. High frequency of mutations of the PIK3CA gene in human cancers. Science. 2004;304(5670):554. doi: 10.1126/science.1096502. - DOI - PubMed
    1. Jia S, Roberts TM, Zhao JJ. Should individual PI3 kinase isoforms be targeted in cancer? Curr Opin Cell Biol. 2009;21(2):199–208. doi: 10.1016/j.ceb.2008.12.007. - DOI - PMC - PubMed

Publication types

MeSH terms

Substances