. 2014 Apr;124(4):1568-81.
doi: 10.1172/JCI70408. Epub 2014 Feb 24.

Pegylated IFN-α regulates hepatic gene expression through transient Jak/STAT activation

Pegylated IFN-α regulates hepatic gene expression through transient Jak/STAT activation

Michael T Dill et al. J Clin Invest. 2014 Apr.

Abstract

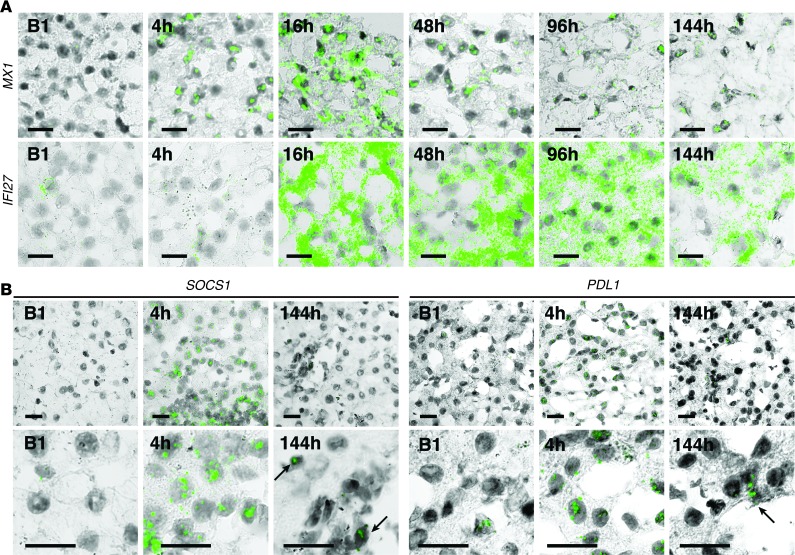
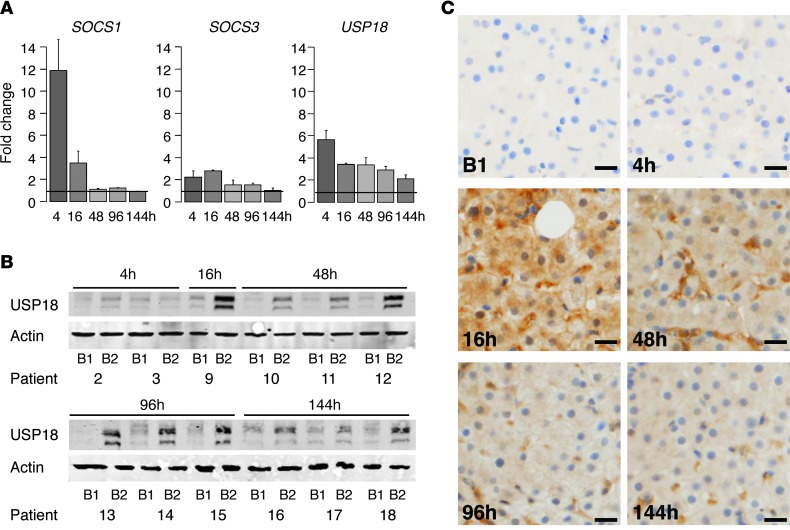
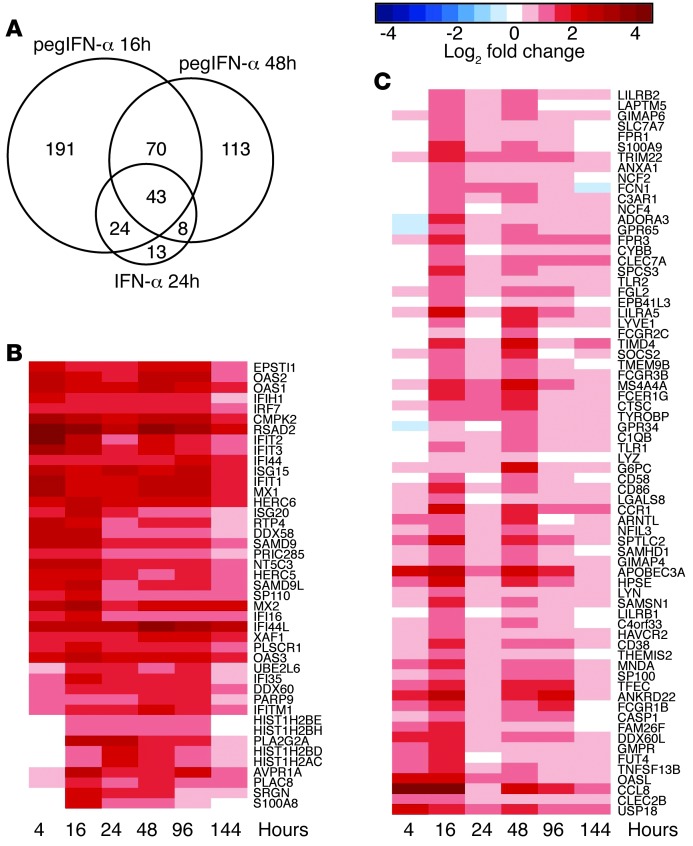
The use of pegylated interferon-α (pegIFN-α) has replaced unmodified recombinant IFN-α for the treatment of chronic viral hepatitis. While the superior antiviral efficacy of pegIFN-α is generally attributed to improved pharmacokinetic properties, the pharmacodynamic effects of pegIFN-α in the liver have not been studied. Here, we analyzed pegIFN-α-induced signaling and gene regulation in paired liver biopsies obtained prior to treatment and during the first week following pegIFN-α injection in 18 patients with chronic hepatitis C. Despite sustained high concentrations of pegIFN-α in serum, the Jak/STAT pathway was activated in hepatocytes only on the first day after pegIFN-α administration. Evaluation of liver biopsies revealed that pegIFN-α induces hundreds of genes that can be classified into four clusters based on different temporal expression profiles. In all clusters, gene transcription was mainly driven by IFN-stimulated gene factor 3 (ISGF3). Compared with conventional IFN-α therapy, pegIFN-α induced a broader spectrum of gene expression, including many genes involved in cellular immunity. IFN-induced secondary transcription factors did not result in additional waves of gene expression. Our data indicate that the superior antiviral efficacy of pegIFN-α is not the result of prolonged Jak/STAT pathway activation in hepatocytes, but rather is due to induction of additional genes that are involved in cellular immune responses.


Figures

Figure 1
Figure 1. pegIFN-α2b transiently induces the Jak/STAT pathway in the liver.
(A) Representative images of IHC analysis of p-STAT1 in liver biopsies obtained before treatment (B1) and at several time points after the first injection of pegIFN-α2b. Strong nuclear p-STAT1 signals were present at the 4- and 16-hour time points, but not at later time points, where the signals were localized in nonparenchymal cells (arrows). Scale bars: 20 μm. (B) Quantitative analysis of the mean percentage of p-STAT1–positive hepatocyte nuclei (5 × 100 cells counted per sample; the number of samples is indicated) per time point. Bars show the mean with SEM.
Figure 2
Figure 2. ISH reveals distinct expression patterns of ISG mRNAs at different time points.
(A) Representative examples of ISH staining (green) in liver biopsies for MX1 and IFI27 mRNA showing that ubiquitous expression gradually declined over time with distinct kinetics. (B) ISH staining (green) in liver biopsies for SOCS1 and PDL1 mRNA revealed expression in hepatocytes and in nonparenchymal cells at 4 hours. At 144 hours, SOCS1 and PDL1 were detected only in nonparenchymal cells (black arrows). Scale bars: 20 μm.
Figure 3
Figure 3. The negative regulator USP18 is continuously upregulated during the entire week after pegIFN-α2b injection.
(A) Bar plot indicating the mRNA expression fold change between the pretreatment biopsy (B1) and the on-treatment biopsy (B2) of SOCS1, SOCS3, and USP18. Data represent the mean with SEM (n = 6 for the 4-hour time point; n = 3 for all other time points). The black line indicates the baseline measured in pretreatment biopsies from the same patients (n = 18). (B) USP18 protein expression by Western blot analysis using whole-cell extracts of liver samples from B1 and B2. Patients are numbered according to Table 1. (C) Representative images of IHC for USP18 of liver biopsies obtained before treatment (B1) and at several time points after the first injection of pegIFN-α2b as indicated. Scale bars: 20 μm.
Figure 4
Figure 4. pegIFN-α2b–induced genes fall into four robust classes with distinct temporal expression patterns.
(A) Number of genes greater than 2-fold up- or downregulated in two-thirds of the patients at each time point. (B) Clustering analysis of the upregulated genes produced four robust clusters (numbers 1–4) composed of early, intermediate, late, and very late ISGs. Boxes represent the quartiles, and whiskers represent 1.5 times the interquartile range. Bold line indicates the median expression value, and the number of genes in each cluster is indicated.
Figure 5
Figure 5. IFN-α2a induces mainly “classical” ISGs, while pegIFN-α2b leads to transcription of additional immune cell–associated genes.
(A) Venn diagram of genes identified as being upregulated by more than 2-fold in two-thirds of the patients at 16 or 48 hours after pegIFN-α2b injection (n = 3 each) or 24 hours after conventional IFN-α injection (n = 6). (B and C) Heatmaps show expression patterns (mean log2 fold change compared with paired pretreatment biopsies) of genes upregulated after IFN-α injection. (B) 43 ISGs were upregulated by conventional IFN-α2a at 24 hours as well as by pegIFN-α2b at both 16 and 48 hours. (C) 70 ISGs were upregulated by pegIFN-α2b at both 16 and 48 hours, but not by conventional IFN-α2a at 24 hours.
Figure 6
Figure 6. MARA reveals ISRE as the most significantly upregulated motif.
(A) Activity changes of the ISRE motif in each patient, as inferred by MARA, showed a significant increase in ISRE activity for every patient at every time point. Shown are inferred activity changes (points) ± 1 SD (bars). (B) Motif activity profiles of the top five motifs with the most significant positive activity changes. Shown are the mean activity changes per time point (lines) ± 1 SEM as well as the P values and sequence logos of the motifs. (C) Fold change of IRF1, IRF7, and IRF9 mRNA expression for every patient. Shown are the mean values with SEM at each time point.
Figure 7
Figure 7. U-STAT1 does not induce ISGs.
(A) Three clones with different expression levels of WT (WT cl1, WT cl2, and WT cl3) or mutated STAT1 (Y701F cl1, Y701F cl2, and Y701F cl3) were stimulated with IFN-α. STAT1-deficient U3A cells and STAT1 WT parental 2fTGH cells were used as controls. IFN-α induced STAT1 phosphorylation in 2fTGH and in all three WT clones. Actin is shown as a loading control. The cells were either untreated or treated for 15 minutes with 1,000 U/ml of IFN-α. WT cl1 and Y701F cl1 express STAT1 in an amount similar to that induced by 2fTGH cells treated for 24 hours with 1,000 U/ml of IFN-α. Shown are representative blots each from three independently performed experiments (black lanes separate blots that were derived from the same gel, but were noncontiguous). (B) IFN-α–induced OAS1 mRNA expression relative to GAPDH was assessed by qRT-PCR. Cells were treated with 1,000 U/ml IFN-α for 8 hours. Upregulation of OAS1 was found only in cells with WT STAT1 after IFN-α treatment. Expression of maximal amounts of Y701F-mutated STAT1 in U3A cells did not induce ISG expression. Shown are the mean values with SEM of three replicate experiments.
Figure 8
Figure 8. Late ISGs show a more prolonged transcriptional induction and a slower mRNA degradation rate than early ISGs in vitro.
(A) mRNA degradation of early (RSAD2, USP18) and late (IFI27, LGALS3BP) ISGs was assessed in Huh7 after induction with 1,000 U/ml of IFN-α for 6 hours at the indicated time points. Transcription was blocked with actinomycin D, and the mRNA degradation over time was compared with GAPDH by qRT-PCR. Results from two independent experiments run in duplicate are shown. (B) Transcription rates of early (RSAD2, USP18) and late (IFI27, LGALS3BP) ISGs over time in Huh7 cells treated with 1,000 U/ml of IFN-α for the indicated time points. In vitro transcription in isolated nuclei was performed for 45 minutes. Newly transcribed mRNA labeled with biotinylated UTP was isolated and assessed by qRT-PCR. Results depicted as relative transcription compared with untreated baseline are shown from two independent experiments run in duplicate.

Comment in

References

    1. Stetson DB, Medzhitov R. Type I interferons in host defense. Immunity. 2006;25(3):373–381. doi: 10.1016/j.immuni.2006.08.007. - DOI - PubMed
    1. Sadler AJ, Williams BR. Interferon-inducible antiviral effectors. Nat Rev Immunol. 2008;8(7):559–568. doi: 10.1038/nri2314. - DOI - PMC - PubMed
    1. Darnell JE, Darnell JE, Jr, Kerr IM, Stark GR. Jak-STAT pathways and transcriptional activation in response to IFNs and other extracellular signaling proteins. Science. 1994;264(5164):1415–1421. doi: 10.1126/science.8197455. - DOI - PubMed
    1. Song MM, Shuai K. The suppressor of cytokine signaling (SOCS) 1 and SOCS3 but not SOCS2 proteins inhibit interferon-mediated antiviral and antiproliferative activities. J Biol Chem. 1998;273(52):35056–35062. doi: 10.1074/jbc.273.52.35056. - DOI - PubMed
    1. Larner AC, Chaudhuri A, Darnell JE, Darnell JE., Jr Transcriptional induction by interferon. New protein(s) determine the extent and length of the induction. J Biol Chem. 1986;261(1):453–459. - PubMed

Publication types

MeSH terms

Substances