Review
. 2014 Apr;15(4):264-78.
doi: 10.1038/nrn3687. Epub 2014 Feb 26.

The log-dynamic brain: how skewed distributions affect network operations

Affiliations
Review

The log-dynamic brain: how skewed distributions affect network operations

György Buzsáki et al. Nat Rev Neurosci. 2014 Apr.

Abstract

We often assume that the variables of functional and structural brain parameters - such as synaptic weights, the firing rates of individual neurons, the synchronous discharge of neural populations, the number of synaptic contacts between neurons and the size of dendritic boutons - have a bell-shaped distribution. However, at many physiological and anatomical levels in the brain, the distribution of numerous parameters is in fact strongly skewed with a heavy tail, suggesting that skewed (typically lognormal) distributions are fundamental to structural and functional brain organization. This insight not only has implications for how we should collect and analyse data, it may also help us to understand how the different levels of skewed distributions - from synapses to cognition - are related to each other.


Figures

Figure 1
Figure 1. Logarithmic distributions at macroscales
a A power spectrum of subdurally recorded local field potentials from the right temporal lobe in a human patient (mean is shown in blue and confidence interval in red). There is a near-linear decrease of power in the logarithmic scale (log power) with increasing frequency in the logarithmic scale (log frequency), except at lower frequencies. b A local field potential trace from layer 5 of the rat neocortex (1 Hz–3 kHz) is shown at the top and a filtered (140–240 Hz) and rectified derivative of a trace from the hippocampal CA1 pyramidal layer is shown at the bottom, illustrating the emergence of ‘ripples’. One ripple event is shown at an expanded timescale. The peak of a delta wave and the troughs of a sleep spindle are marked by asterisks. c A hippocampal ripple-triggered power spectrogram of neocortical activity centred on hippocampal ripples. Ripple activity is modulated by the sleep spindles (as shown by the power in the 10–18 Hz band), both events are modulated by the slow oscillation (the strong red band at 0–3 Hz), and all three oscillations are biased by the phase of the ultraslow rhythm (approximately 0.1 Hz, indicated by asterisks). Such cross-frequency modulation of rhythms, driven from lower to higher frequencies, as shown in panels b and c, is found throughout the brain and forms the basis of the hierarchical organization of multiple timescales. AU, arbitrary units. Data in part a from REF. . Parts b and c are reproduced, with permission, from REF. © (2003) National Academy of Sciences USA.
Figure 2
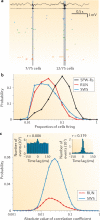
Figure 2. Skewed distribution of the magnitude of population synchrony
a Wide band and ripple-band (140–230 Hz) filtered local field potential (trace) and spiking activity (coloured dots) of 75 simultaneously recorded CA1 pyramidal cells. The shaded areas indicate two ripple events during which a relatively low (0.09) and high (0.16) fraction of neurons fire synchronously. b The probability distribution of the synchrony of CA1 pyramidal cells’ firing. The x axis shows the proportion of cells that fired during sharp-wave ripples (SPW-Rs) or in 100 ms time windows during theta periods in behavioural tasks (RUN) and slow-wave sleep (SWS), including ripple events. c Probability distribution of the magnitude of the pairwise correlation coefficient among pairs of neurons during theta periods in a behavioural task (RUN) and during SWS, recorded at 50 ms time resolution; only significantly correlated (P < 0.05) cell pairs are shown. Insets show cross-correlograms of poorly synchronized (left) and highly synchronous (right) neuron pairs during SWS. The graphs in panels b and c show that the probability distributions can be characterized as lognormal. Panel a is reproduced, with permission, from REF. © (2013) Elsevier. Data in parts b and c from REF. .
Figure 3
Figure 3. Lognormal distribution of firing rates in the cortex
a Siliocon probe recordings in the rat brain showing the firing-rate distribution of principal cells in the hippocampus (CA1, CA3 and dentate gyrus (DG)) and the entorhinal cortex (EC; specifically, in layers 2, 3 and 5) during slow-wave sleep (SWS; left panel) and exploration (RUN; right panel). b Whole-cell patch recordings showing the firing-rate distribution of neurons in the auditory cortex of awake rats. The two distributions show all cells and a subset, from which seven neurons with narrow spikes (that is, putative fast-firing interneurons (FFIs)) are excluded. c Silicon probe recordings in the rat brain showing the firing-rate distribution of superficial (layers 2/3) and layer 5 neurons in the prefrontal cortex of an exploring rat. Neurons with a peak firing rate in the maze (<1 Hz) were excluded from the analysis. d | Recordings (using sharp metal electrodes) showing firing-rate distribution of neurons from lateral intraparietal and parietal reach region areas of the macaque cortex during a baseline condition and during performance of a reaching task. Data from principal cells and interneurons are not separated. e Utah array recordings showing firing-rate distribution of neurons in the human middle temporal gyrus during sleep. Principal cells and putative interneurons are plotted separately. f Firing-rate distribution of neurons in multiple cortical areas of human patients recorded with metal electrodes during various tasks. g Distribution of spatial features of dorsal hippocampal CA1 pyramidal neurons of rats exploring an open field, showing a lognormal distribution of spike information for place field representation. Spatial information is an information-theoretical measurement of place field sharpness. The proportion of cells plotted against the spatial information content per spike (bits per spike) are shown in dark blue; the proportion of cells plotted against the spatial information rate (bits per second) are shown in light blue; and the proportion of place fields plotted against place field size (cm2) are shown in red. AU, arbitrary units. Data in part a from REF. . Data in part b from REF. . Data in part c from REF. . Data in part d courtesy of A. Berardino, New York University, USA, and B. Pesaran, New York University, USA. Part e is reproduced from REF. . Data in part f courtesy of M. Kahana, University of Pennsylvania, USA. Data in part g from REF. .
Figure 4
Figure 4. Firing rates of principal neurons are preserved across brain states and environments
a The firing rates of the same CA1 pyramidal neurons in the rat during slow-wave sleep (SWS) and rapid eye movement (REM) sleep are correlated. b The firing rates of the same CA1 pyramidal neurons during exploration (RUN) and REM sleep are also correlated. c The firing rates of the same neurons in different mazes are correlated. d Firing-rate correlation of neurons during RUN in a novel maze and SWS in the home cage (before the maze session). e Firing-rate correlation in the mouse barrel cortex during background and object localization by whiskers. f Correlations of background and evoked firing rates in the lateral intraparietal (LIP) and parietal reach region (PRR) cortical areas of the macaque monkey. Part a is reproduced, with permission, from REF. © (2001) National Academy of Sciences USA. Data in panels bd from REF. . Data in part e from REF. . Data in part f courtesy of A. Berardino, New York University, USA, and B. Pesaran, New York University, USA.
Figure 5
Figure 5. Lognormal distribution of synaptic weights and spike transfer probability
a Six intracellularly recorded and biocytin-filled neurons in the barrel cortex of the mouse in vitro. b A colour-coded synaptic connectivity diagram of the six neurons in part a. c Corresponding colour-coded membrane potential traces showing presynaptic action potentials (top trace in each set) and unitary excitatory postsynaptic potentials (uEPSPs; bottom trace (or traces) in each set) in the synaptically connected neurons. d The distribution of synaptic weights in the mouse barrel cortex and rat visual cortex. e The graph in the lower panel shows the distribution of spike transmission probability values between CA1 pyramidal cells and putative interneurons during exploration (RUN) and slow-wave sleep (SWS). The top panel shows superimposed filtered waveforms (800 Hz–5 kHz) of a pyramidal cell (pyr) and an interneuron (int) triggered by spiking of the pyramidal cell. f The correlation of spike transmission probability during RUN and spike transmission probability during SWS. Each dot represents a single cell pair. g Examples of spines imaged along the dendrites of one neuron. The numbers indicate the size of the spine in arbitrary units (AU). The graph in the lower panel shows the lognormal distribution of sizes of all spines. h The top panel shows spines in the auditory cortex of the mouse in which calcium signals (indicating activity) were recorded (red). The middle panel shows activity indicating a spontaneous up state. The bottom panel shows a comparison of the response rate of spine calcium responses during sound stimulation (evoked (E)) and spontaneous (S) up states. Note that individual spines showed similar calcium response rates during spontaneous and evoked activities. Parts ac are reproduced, with permission, from REF. © (2009) Elsevier. Data in part d from REF. (blue line) and REF. (red line). Parts ef are reproduced, with permission, from REF. © (2013) Elsevier. Part g is reproduced, with permission, from REF. © (2011) Society for Neuroscience. Part h is reproduced, with permission, from REF. © (2013) Elsevier.
Figure 6
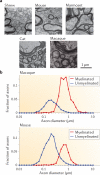
Figure 6. Skewed distribution of axon calibres
a Representative micrographs of callosal tissue in different species. Note the various sizes of axon diameters. b The distribution of diameters of unmyelinated and myelinated axons in the corpus callosum of the macaque monkey and mouse. Note the lognormal-like distribution of axon diameters. Data from REF. .

References

    1. Barabasi AL, Albert R. Emergence of scaling in random networks. Science. 1999;286:509–512. - PubMed
    1. Sporns O. Networks of the Brain. MIT Press; 2010.
    1. Limpert E, Stahel WA, Abbt M. Lognormal distributions across the sciences: keys and clues. Bioscience. 2001;51:341–352.
    1. Weber H. Annotationes Anatomicae et Physiologicae. Koehler; German: 1834. De Pulsa Resorptione Auditu et Tactu.
    1. Fechner GT. Elemente der Psychophysik. Breitkopf und Härtel; German: 1860.

Publication types