. 2014 Apr 1;33(7):686-701.
doi: 10.1002/embj.201386003. Epub 2014 Feb 25.

Cell segregation in the vertebrate hindbrain relies on actomyosin cables located at the interhombomeric boundaries

Affiliations

Cell segregation in the vertebrate hindbrain relies on actomyosin cables located at the interhombomeric boundaries

Simone Calzolari et al. EMBO J. .

Abstract

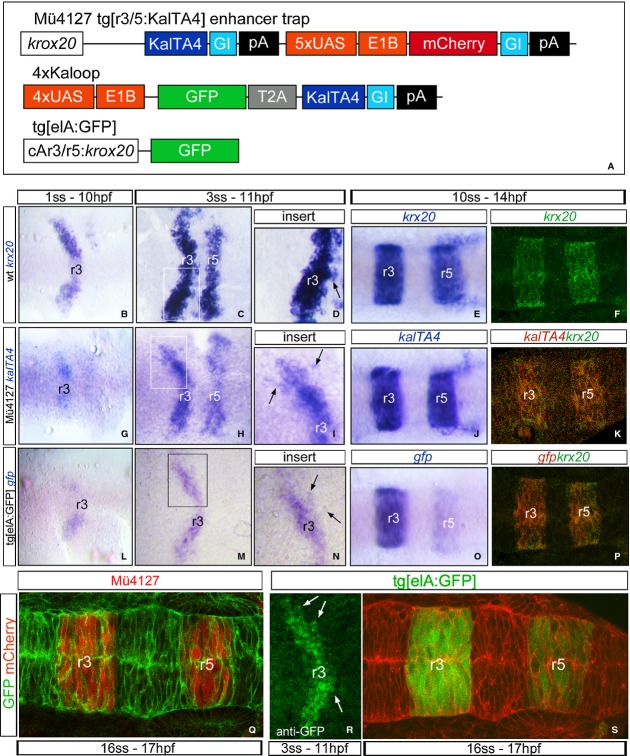
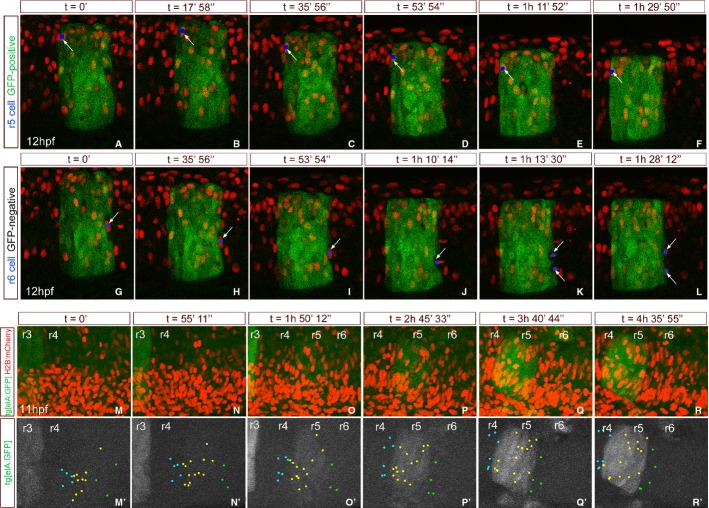
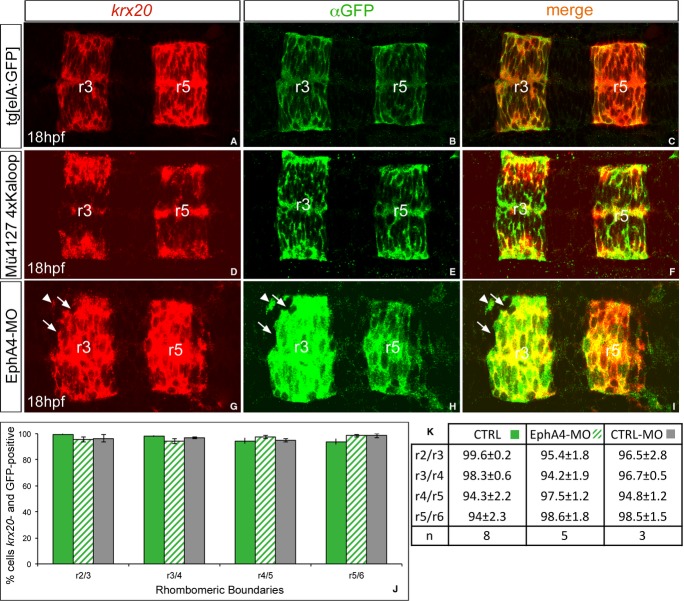
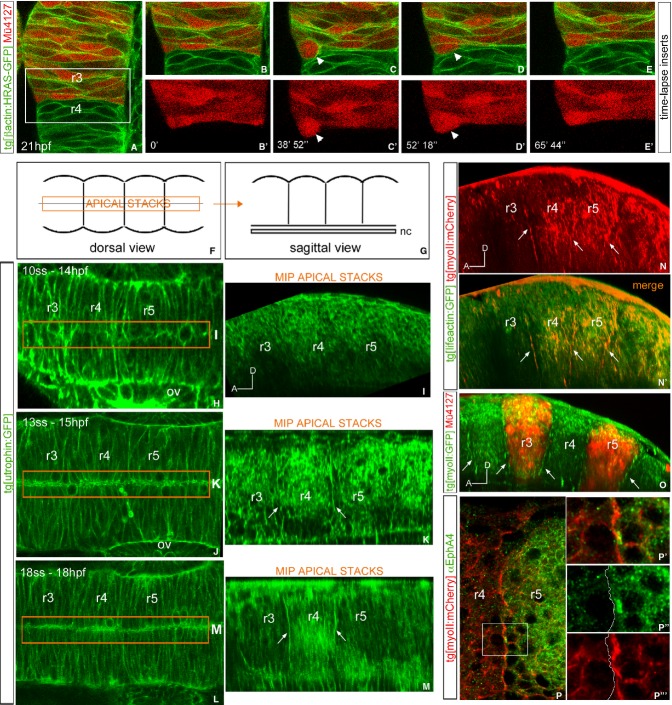
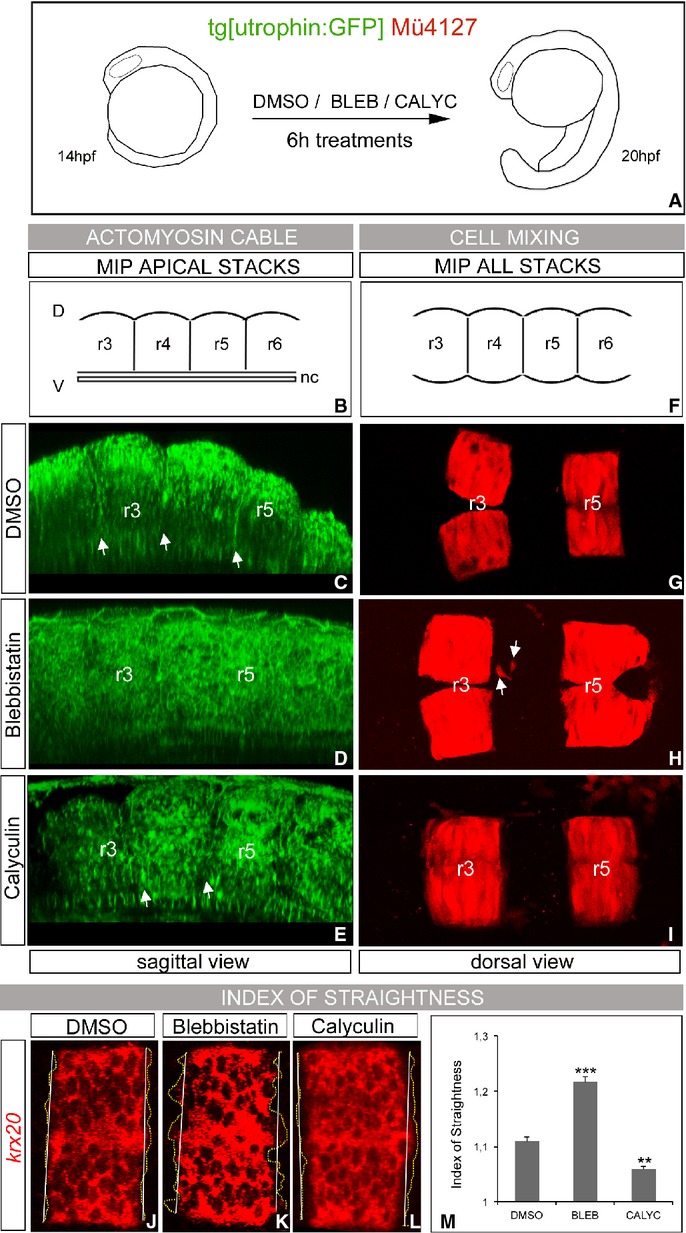
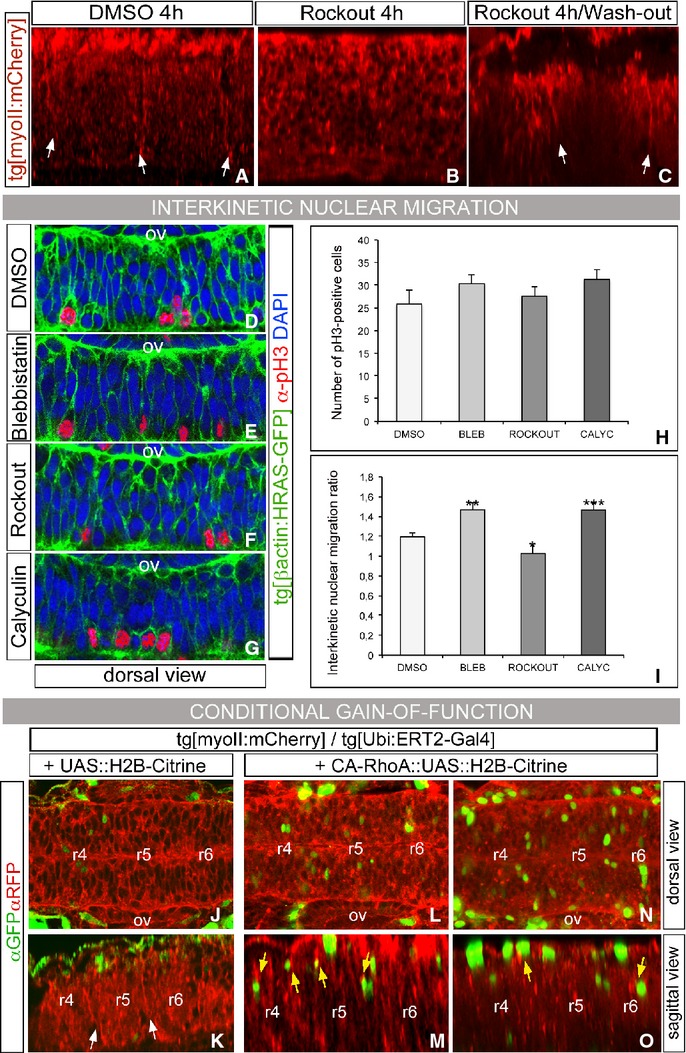
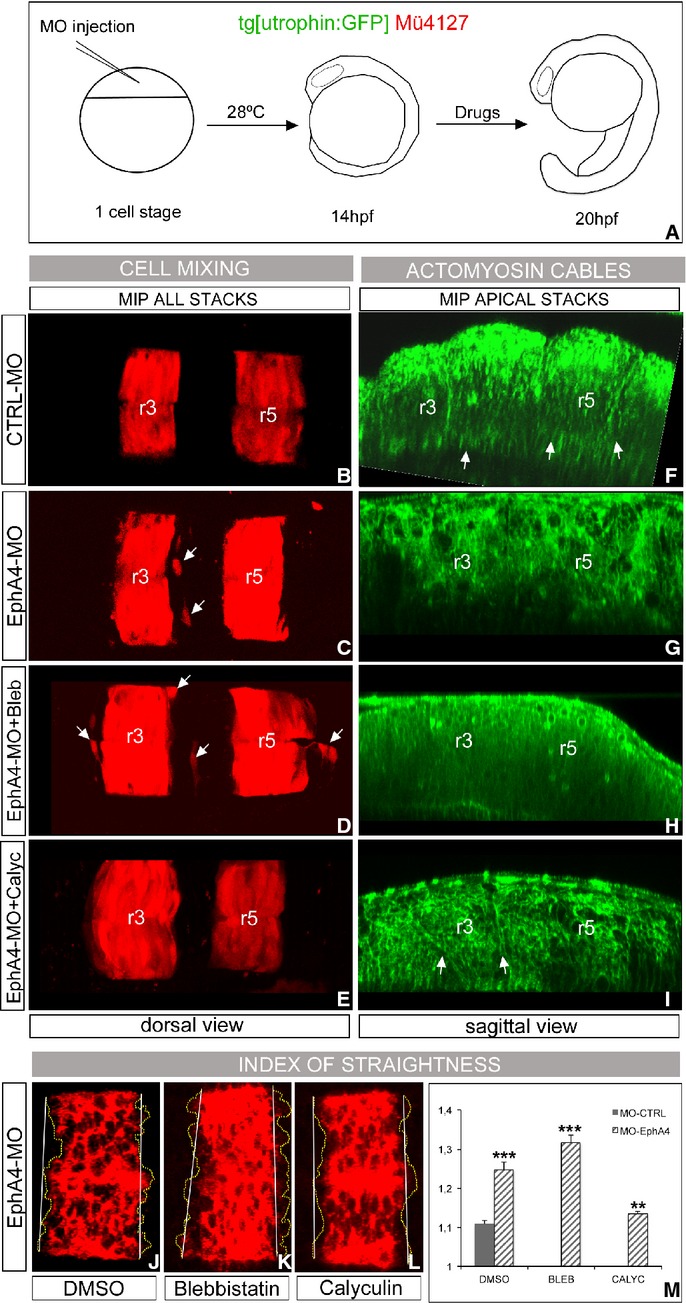
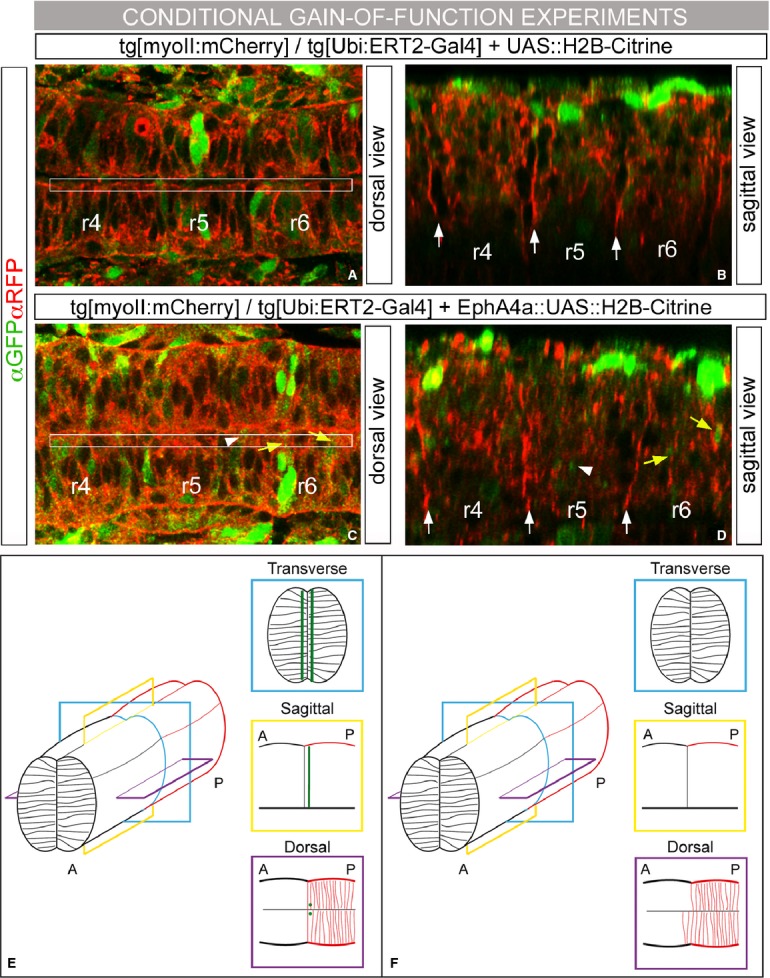
Segregating cells into compartments during embryonic development is essential for growth and pattern formation. Physical mechanisms shaping compartment boundaries were recently explored in Drosophila, where actomyosin-based barriers were revealed to be important for keeping cells apart. In vertebrates, interhombomeric boundaries are straight interfaces, which often serve as signaling centers that pattern the surrounding tissue. Here, we demonstrate that in the hindbrain of zebrafish embryos cell sorting sharpens the molecular boundaries and, once borders are straight, actomyosin barriers are key to keeping rhombomeric cells segregated. Actomyosin cytoskeletal components are enriched at interhombomeric boundaries, forming cable-like structures in the apical side of the neuroepithelial cells by the time morphological boundaries are visible. When myosin II function is inhibited, cable structures do not form, leading to rhombomeric cell mixing. Downregulation of EphA4a compromises actomyosin cables and cells with different rhombomeric identity intermingle, and the phenotype is rescued enhancing myosin II activity. Moreover, enrichment of actomyosin structures is obtained when EphA4 is ectopically expressed in even-numbered rhombomeres. These findings suggest that mechanical barriers act downstream of EphA/ephrin signaling to segregate cells from different rhombomeres.


Figures

Figure 1
Figure 1. Characterization of the zebrafish transgenic lines used in the study
A Scheme of the inserted transgenes in the zebrafish lines. B–P Spatiotemporal characterization of the expression of the transgene (kalTA4, gfp) in the different transgenic lines by in situ hybridization compared with endogenous expression of krx20 in wt embryos. Note that at early stages of embryonic development in all zebrafish strains, krx20, kalTA4, or gfp-positive cells are found surrounded by cells of different identity (D,I,N, for magnifications, see arrows); later on, clear and sharp gene expression domains are generated (E–F, J, O). (K, P) Double in situ hybridization with krx20 (green) and kalTA4 or gfp (red); note the krx20 expression domain overlaps with the expression of the reporter genes. Q–S Spatial characterization of the reporter fluorescence protein expression in the two different transgenic lines injected with mRNA driving expression to the plasma membrane such as lyn:GFP or memb:mCherry. (R) Anti-GFP immunostaining of Tg[elA:GFP] embryos at 3 ss (11 hpf). Note that GFP-positive cells within the jagged boundary of r3 are surrounded by GFP-negative cells (see white arrows). Dorsal views with anterior to the left.
Figure 2
Figure 2. Tracking of single cells shows that rhombomeric cells are sorted out from territories with different rhombomeric identity. In vivo imaging of Tg[elA: GFP] embryos injected with H2B-mCherry mRNA at 4- to 8-cell stage
A–L Time-lapse of an embryo from 12 hpf onwards where we tracked: (A–F) a single GFP-positive cell from r5 (see blue dot pointed with white arrow); (G–L) a single GFP-negative cell from r6 that divides into two GFP-negative cells (see blue dots pointed with white arrows). Single confocal stacks. See Supplementary Movies S1 and S2 for original data. M–R Time-lapse of an embryo at 11 hpf where several single cell trajectories within r3–r6 were back-tracked. Merge of the maximal projections of the green and red channels, displaying in green the emergence of r3 first and later r5 and in red all labeled cell nuclei. M'–R' Green channel displayed in white, to observe the appearance of r3 first and then r5, and the position of all tracked cells with colored dots. Light-blue dots correspond to r4 cells, yellow dots to r5 cells, and green dots to r6 cells. See Supplementary Movie S3 for original data. Note that cells at the boundaries that at the last time point are segregated were intermingled at the beginning of the movie. Dorsal views with anterior to the left.
Figure 3
Figure 3. Cell sorting is the main cellular mechanism involved in molecular boundary refinement
A–I Fluorescent krx20 in situ hybridization (red) followed by anti-GFP immunostaining (green) to detect the expression of the reporter gene under the control of krx20 in the different transgenic zebrafish lines: (A–C) Tg[elA:GFP] and (D–F) double transgenic Mü4127 4xKaloop embryos, which express GFP in r3 and r5; (G–I) Tg[elA:GFP] embryos injected with MO-EphA4a. Note that in all cases cells co-express krx20 (red) and GFP (green). Even upon disruption of cell sorting after EphA4a-morpholino injection, when a given cell is found isolated, it expresses either both markers (see white arrow heads) or none (see white arrows). All images are dorsal views with anterior to the left. J, K Quantification of cells expressing krx20 and GFP in the vicinity of all rhombomeric boundaries. Green bars: non-injected Tg[elA:GFP] embryos; dashed bars: Tg[elA:GFP] embryos injected with MO-EphA4a; gray bars: Tg[elA:GFP] embryos injected with MO-CTRL.
Figure 4
Figure 4. Actomyosin cables are present at the interrhombomeric boundaries
A–E' Dorsal views of time-lapse stacks of rhombomeres 3 (red) and 4 of Tg[βactin:HRAS-GFP]/Mü4127 embryos from 21 hpf onwards. (B–E′) Inserts of the region framed in (A). Note that a cell upon division challenges the boundary (see white arrow head). Anterior is to the top. See Supplementary Movie S5 for the original data. F–O Presence of F-actin and myosin II in the hindbrain. (H,J,L) Dorsal views of Tg[utrophin:GFP] embryos from 14 to 18 hpf. (I,K,M) Sagittal-optical sections of same embryos obtained as maximal intensity projections of the XZ apical planes depicted in (H,J,L) within the orange frame. See scheme in (F–G) for further clarity and Supplementary Fig S7A for more exhaustive explanations. Arrows point to the enrichment of F-actin. Note that the enrichment of F-actin structures can be observed from 15 hpf onwards, once the morphological rhombomeric bulges are visible (Supplementary Fig S4). (N–N′) Sagittal-optical views obtained as in (G) of double transgenic Tg[lifeactin:GFP]/Tg[myoII:mCherry] embryos showing that interhombomeric cables are formed by F-actin and myosin II (see arrows). Myosin II can be seen in red (N), and its merge with F-actin in yellow (N′). (O) Sagittal-optical view from double transgenic Tg[myoII:GFP]/Mü4127 embryos where myosin II cables are located in the interhombomeric boundaries (see arrows). P–P′′′ Sagittal section of Tg[myoII:mCherry] embryos immunostained for anti-EphA4. (P–P′) Merge of anti-EphA4 staining (green) and myosin II (red); (P′–P′′′) are inserts from the region framed in (P). (P′′) displays only the EphA4 staining (the border of expression is outlined), and (P′′′) the actomyosin cable position is compared with the EphA4-expression border (white line). Anterior is always to the left.
Figure 5
Figure 5. Actomyosin barriers prevent cell intermingling between rhombomeres
A–I Presence of actomyosin cables and effects in rhombomeric cell segregation. (A) Scheme depicting the experiment: double transgenic Tg[utrophin:GFP]/Mü4127 embryos at 14 hpf were treated with DMSO as control (C, G), or with different pharmacological agents that modulate the function of the actomyosin cable, such as (D, H) Blebbistatin and (E–I) Calyculin A. (C–E) show the presence/absence of the actomyosin cable in sagittal-optical sections obtained as maximal intensity projections of the XZ apical planes, and (G–I) display maximal intensity projections of dorsal views of r2–r6 region to observe the extent of cell mixing. Note that once the actomyosin cable is disrupted (D), ectopic r3/r5 cells are found in r4 (H, white arrows). Anterior is always to the left. (B,F) are schemes to help in the comprehension of the 3D-tissue organization. J–M Analysis of the index of straightness (IS) within the krx20 expression border: (J–L) wt embryos were treated with same pharmacological agents as in previous experiment and assayed for krx20 in situ hybridization. Note that upon Blebbistatin treatment, the border of krx20-expression is very fuzzy compared with the sharp border displayed by DMSO- or Calyculin A-treated embryos. Anterior is to the left. (M) Quantification of the index of straightness (IS) upon different conditions. IS was measured according to Supplementary Fig S7B. ***P < 0.001, **P < 0.005.
Figure 6
Figure 6. Drug treatments have specific effects on actomyosin cable assembly
A–C Wash-out experiments: Tg[myoII:mCherry] embryos at 14 hpf were treated with DMSO (A) or Rockout for 4 h (B–C). Then, embryos were either analyzed (A–B) or let to develop for 3 h after washing out the Rockout (C). The presence of cables was revealed with anti-DsRed immunostaining. Sagittal-optical sections obtained as maximal intensity projections of the XZ apical planes with anterior to the left. D–I Tg[βactin:HRAS-GFP] embryos upon different treatments were stained for anti-pH3 to visualize mitotic cells and counterstained with DAPI to singularize cell nuclei. Dorsal views of half-side rhombomeres (r4–r6 region), with anterior to the left and apical to the bottom. Images were analyzed according to Supplementary Fig S8 and the data obtained were plotted as: (H) number of cells undergoing mitosis in the hindbrain (pH3-positive cells), and (I) interkinetic nuclear migration ratio, which is calculated as the number of nuclei located in the apical side of the cells divided by the number of nuclei located in the basal side of the cells (DAPI-positive cells). ***P < 0.001 **P < 0.005. J–O Conditional ectopic expression of H2B-Citrine or CA-RhoA:H2B-Citrine using the Ubi::ERT2-Gal4 system. Tg[myoII:mCherry]/Tg[Ubi:ERT2-Gal4] embryos were injected either with UAS::H2B-Citrine as control (J–K) or with CA-RhoA::UAS::H2B-Citrine (L–O) and incubated from 14 hpf with hydroxytamoxifen for 4 h to conditionally activate the transgene. The expression of the corresponding transgene can be followed in green, and myosin II structures in red after αGFP/αRFP immunostaining. Note the enrichment of myosin II structures upon CA-RhoA (M, O) induction in two different embryos. Ectopic CA-RhoA is sufficient to assemble myosin II structures in any rhombomere (see yellow arrows in r4, r5, and r6). (J, L, N) are dorsal views and (K, M, O) are sagittal-like views. Anterior is always to the left.
Figure 7
Figure 7. EphA/ephrin signaling is upstream of the generation of the actomyosin cables
A–I Presence of actomyosin cables and effects in rhombomeric cell segregation. (A) Scheme of the functional experiment: double transgenic Mü4127/Tg[utrophin:GFP] embryos injected with CTRL-MO (B, F) or EphA4a-MO (C–I) at 1- to 2-cell stage, incubated from 14 hpf for 6 h with DMSO (B–G), Blebbistatin (D, H), or Calyculin A (E, I). After the treatment, the degree of cell mixing (B–E) and the presence of actomyosin cables (F–I, see arrows) were assessed. Embryos injected with CTRL-MO behave as control embryos (DMSO) in previous experiments. Note the cell mixing in embryos in which the cable was dismantled (white arrows, in C–D, G–H), and the partial rescue of the cable in EphA4a-MO embryos treated with Calyculin A (white arrows in I) resulting in no cell mixing (E). Dorsal views (B–E) and sagittal-optical views of apical stacks (F–I); in all cases anterior is to the left. J–M Analysis of the index of straightness (IS) in wt embryos injected with EphA4a-MO at 1- to 2-cell stage, incubated from 14 hpf for 6 h with different pharmacological agents, and assayed for krx20 in situ hybridization. Note the jagged krx20 expression domains upon Blebbistatin treatment, and how the effect of EphA4a-MO is enhanced. IS is partially rescued in morphants upon Calyculin A treatment. Dorsal views with anterior to the left. (M) Quantification of the IS for embryos in experiment (J–L) (dashed bars), and comparison with control embryos (solid bar). ***P < 0.001, **P < 0.005.
Figure 8
Figure 8. Conditional activation of EphA/ephrin signaling can induce ectopic enrichment of cable structures
A–D Conditional ectopic expression of H2B-Citrine or EphA4a:H2B-Citrine using the Ubi::ERT2-Gal4 system. Tg[myoII:mCherry]/Tg[Ubi:ERT2-Gal4] embryos were injected either with UAS::H2B-Citrine as control (A–B) or with EphA4a::UAS::H2B-Citrine (C–D), and incubated from 14 hpf with hydroxytamoxifen for 4 h to conditionally activate the transgene. The expression of the corresponding transgene can be followed in green, and myosin II structures in red after aGFP/aRFP immunostaining. (A, C) are dorsal views and (B, D) sagittal-like views of the region framed in (A) and (C) of the same embryo with anterior to the left. E, F Model for the requirement of actomyosin cables in the interhombomeric boundaries to keep distinct rhombomeric cell populations segregated. Schematic 3D-representation of the hindbrain territory depicting two adjacent rhombomeres. Three different orthogonal views are taken from this scheme: transverse (blue), sagittal (yellow), and dorsal (purple). Actomyosin cables are represented as green lines in transverse and sagittal views and as green dots in the dorsal view. To help clarity, in the dorsal view cells are represented only for the posterior rhombomere (red cells). (E) DMSO-, CRTL-MO-, or Calyculin A-treated embryos. Note the sharp boundary in the dorsal view. (F) Blebbistatin-, Rockout- and EphA4a-MO-treated embryos. Actomyosin cables are dismantled and cells from the posterior compartment cross the boundary to the anterior compartment. The AP axis is indicated in the diagram.

Similar articles

Cited by

References

    1. Aliee M, Röper JC, Landsberg KP, Pentzold C, Widmann TJ, Jülicher F, Dahmann C. Physical mechanisms shaping the Drosophila dorsoventral compartment boundary. Curr Biol. 2012;22:967–976. - PubMed
    1. Balciunas D, Wangensteen KJ, Wilber A, Bell J, Geurts A, Sivasubbu S, Wang X, Hackett PB, Largaespada DA, McIvor RS, Ekker SC. Harnessing a high cargo-capacity transposon for genetic applications in vertebrates. PLoS Genet. 2006;2:e169. - PMC - PubMed
    1. Batlle E, Wilkinson DG. Molecular mechanisms of cell segregation and boundary formation in development and tumorigenesis. Cold Spring Harb Perspect Biol. 2012;4:a008227. - PMC - PubMed
    1. Becam I, Rafel N, Hong X, Cohen SM, Milán M. Notch-mediated repression of bantam miRNA contributes to boundary formation in the Drosophila wing. Development. 2011;138:3781–3789. - PubMed
    1. Behrndt M, Salbreux G, Campinho P, Hauschild R, Oswald F, Roensch J, Grill SW, Heisenberg CP. Forces driving epithelial spreading in zebrafish gastrulation. Science. 2012;338:257–260. - PubMed

Publication types

MeSH terms