Comparative Study
. 2014 Feb 26:4:4202.
doi: 10.1038/srep04202.

Stomach microbiota composition varies between patients with non-atrophic gastritis and patients with intestinal type of gastric cancer

Affiliations
Comparative Study

Stomach microbiota composition varies between patients with non-atrophic gastritis and patients with intestinal type of gastric cancer

Francisco Aviles-Jimenez et al. Sci Rep. .

Abstract

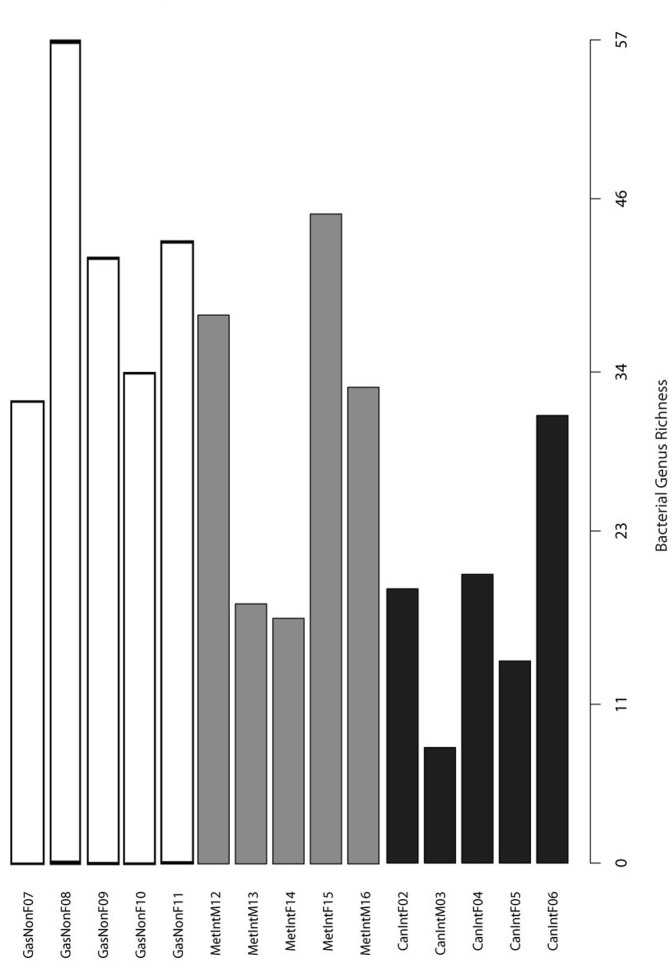
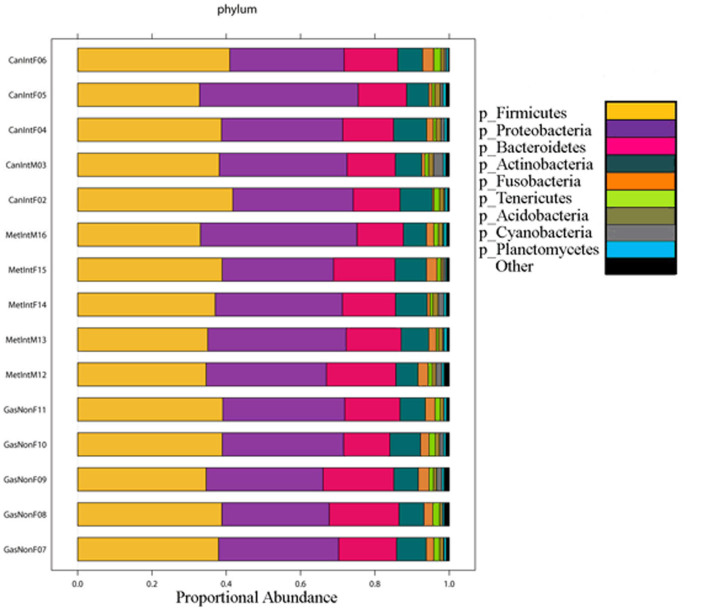
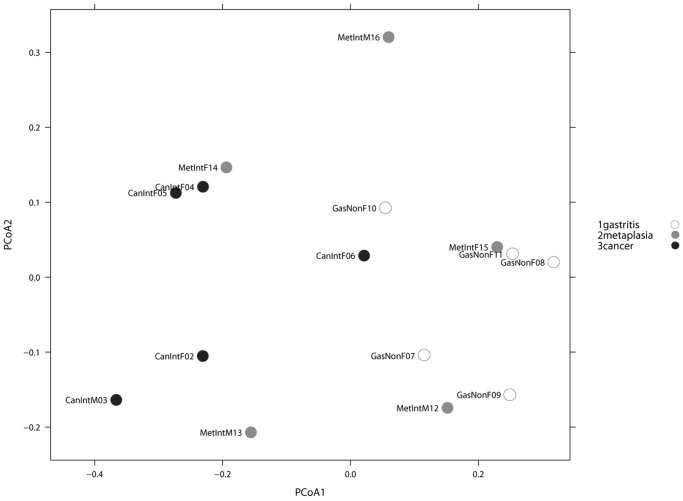
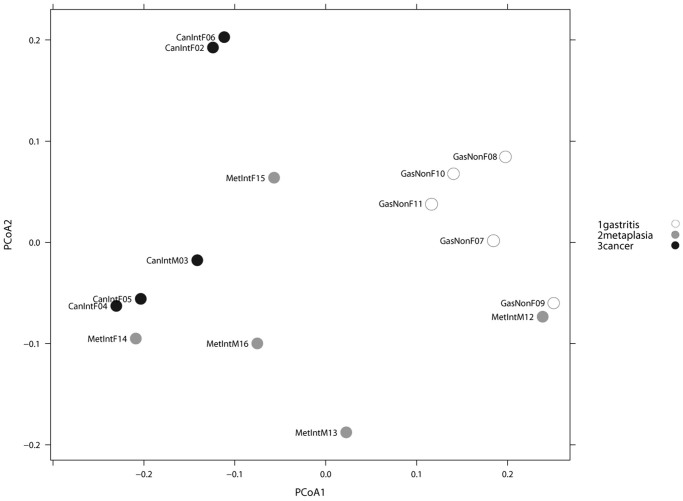
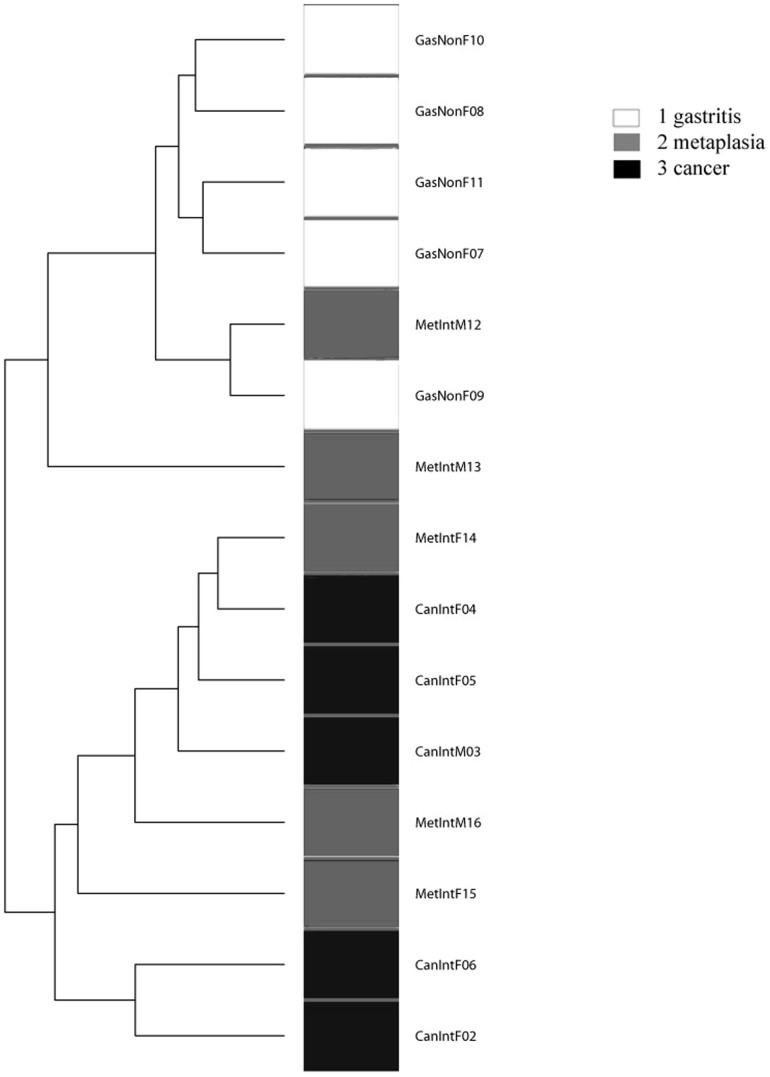
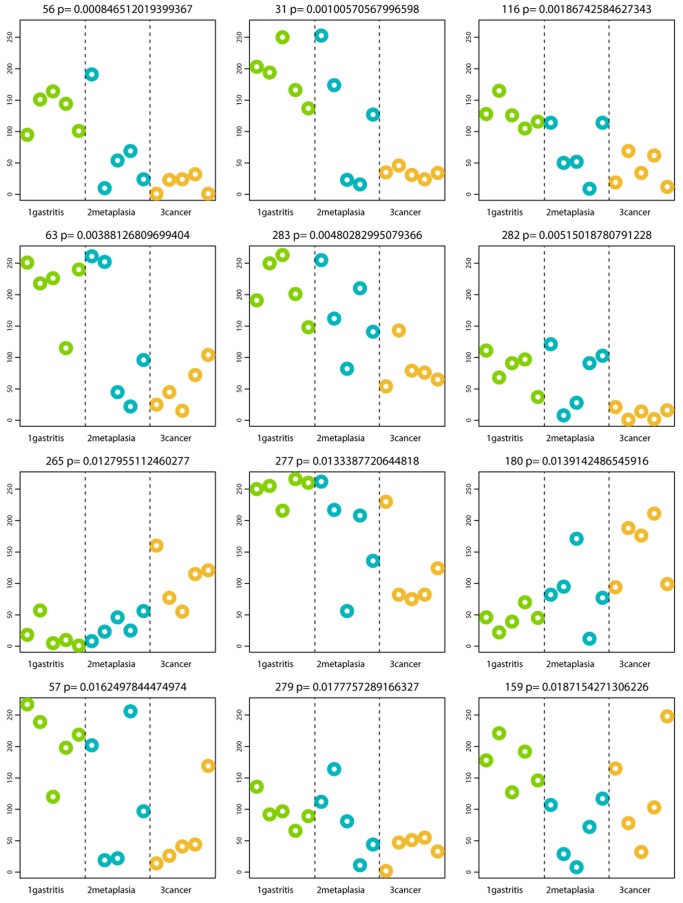
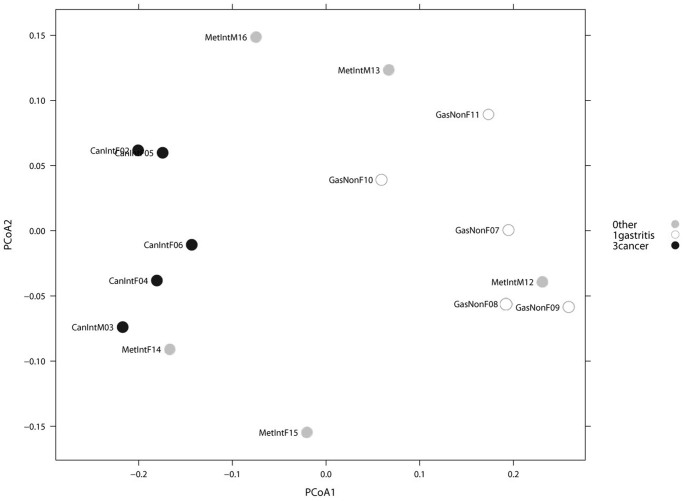
We aimed to characterize microbiota of the gastric mucosa as it progress to intestinal type of cancer. Study included five patients each of non-atrophic gastritis (NAG), intestinal metaplasia (IM) and intestinal-type gastric cancer (GC). Gastric tissue was obtained and DNA extracted for microbiota analyses using the microarray G3 PhyloChip. Bacterial diversity ranged from 8 to 57, and steadily decreased from NAG to IM to GC (p = 0.004). A significant microbiota difference was observed between NAG and GC based on Unifrac-presence/absence and weighted-Unifrac-abundance metrics of 283 taxa (p < 0.05). HC-AN analyses based on presence/absence of 238 taxa revealed that GC and NAG grouped apart, whereas IM overlapped with both. An ordinated analyses based on weighted-Unifrac distance given abundance of 44 taxa showing significance across categories revealed significant microbiota separation between NAG and GC. This study is the first to show a gradual shift in gastric microbiota profile from NAG to IM to GC.


Figures

Figure 1
Figure 1. Microbial diversity.
Bacterial taxon diversity at the genus level in the gastric microbiota of patients with non-atrophic gastritis (GasNon), intestinal metaplasia (MetInt) and gastric cancer of the intestinal type (CanInt). Bacterial diversity was significantly higher in non-atrophic gastritis than in gastric cancer patients (p = 0.004, heteroscadastic t-test).
Figure 2
Figure 2. Abundance of OTUs.
Proportion of OTUs at the phylum level in the gastric microbiota of patients with non-atrophic gastritis (GasNon), intestinal metaplasia (MetInt) and gastric cancer of the intestinal type (CanInt). Firmicutes and Proteobacteria represented almost 70% of phyla in each sample.
Figure 3
Figure 3. PCoA analyses Unweighted Unifrac.
PCoA analyses of the gastric microbiota in non-atrophic gastritis vs intestinal metaplasia vs gastric cancer, based on Unweighted Unifrac distance between samples given presence/absence of 283 taxa present in at least one sample. Axis 1 explained 30% of variation and axis 2, 13%. Adonis test yielded a p-value of 0.026, indicating significant microbiota difference between at least one of the sample categories from the others.
Figure 4
Figure 4. PCoA analyses Weighted Unifrac.
PCoA analyses of the gastric microbiota in non-atrophic gastritis vs intestinal metaplasia vs gastric cancer, based on Weighted Unifrac distance between samples given abundance of 27 taxa with significant abundance difference across at least one of the categories. Axis 1, explained 55% of variation and axis 2, 22%. An entire separation of the microbiota of non-atrophic gastritis and gastric cancer groups along the PCoA1 axis was observed.
Figure 5
Figure 5. Hierarchical Clustering of the gastric microbiota.
Analysis based on Weighted Unifrac distance between samples given abundance of 27 taxa with significant abundance differences across at least one of the categories. A distinct clustering was observed between non-atrophic gastritis and gastric cancer, whereas intestinal metaplasia overlapped with these two groups.
Figure 6
Figure 6. Profiles of the top 12 OTUs generating the lowest p-values distinguishing disease groups.
P-values shown at top of each OTU plot are unadjusted for multiple testing. The y-axis represents the HybScore (integers of fluorescence intensity). Samples are grouped and colored by category along the x-axis in the following order: GasNonF08, GasNonF09, GasNonF10, GasNonF11; MetIntM12, MetIntM13, MetIntF14, MetIntF15, MetIntM16; CanIntF02, CanIntM03, CanIntF04, CanIntF05, CanIntF06.
Figure 7
Figure 7. Non-atrophic gastritis vs gastric cancer.
PCoA analyses of the gastric microbiota in non-atrophic gastritis vs gastric cancer, based on Weighted Unifrac distance between samples, given abundance of 44 taxa with significant abundance difference across at least one of the categories. Axis 1 explained 62% of variation and axis 2, 14%. A significant separation of microbiota between non-atrophic gastritis and gastric cancer was observed.

References

    1. Bjorkholm B., Falk P., Engstrand L. & Nyren O. Helicobacter pylori: resurrection of the cancer link. J Intern Med 253, 102–119, 1119 (2003). - PubMed
    1. Allison C. C. & Ferrero R. L. Role of virulence factors and host cell signaling in the recognition of Helicobacter pylori and the generation of immune responses. Future Microbiol 5, 1233–1255, 10.2217/fmb.10.84 (2010). - PubMed
    1. Gianfagna F., De Feo E., van Duijn C. M., Ricciardi G. & Boccia S. A systematic review of meta-analyses on gene polymorphisms and gastric cancer risk. Curr Genomics 9, 361–374, 10.2174/138920208785699544 (2008). - PMC - PubMed
    1. Tsugane S. & Sasazuki S. Diet and the risk of gastric cancer: review of epidemiological evidence. Gastric Cancer 10, 75–83, 10.1007/s10120-007-0420-0 (2007). - PubMed
    1. Correa P. & Houghton J. Carcinogenesis of Helicobacter pylori. Gastroenterology 133, 659–672, 10.1053/j.gastro.2007.06.026 (2007). - PubMed

Publication types