. 2014 Apr 15;306(8):E883-92.
doi: 10.1152/ajpendo.00009.2014. Epub 2014 Feb 25.

Reduced nocturnal ACTH-driven cortisol secretion during critical illness

Affiliations

Reduced nocturnal ACTH-driven cortisol secretion during critical illness

Eva Boonen et al. Am J Physiol Endocrinol Metab. .

Abstract

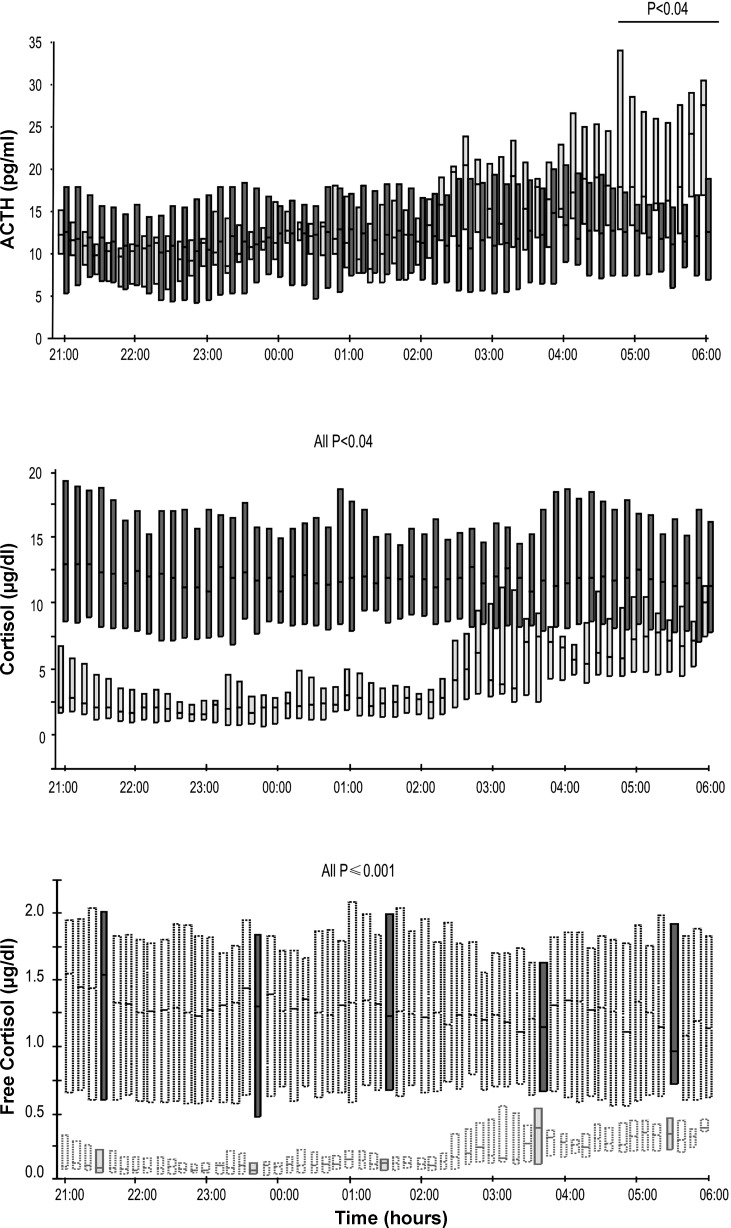
Recently, during critical illness, cortisol metabolism was found to be reduced. We hypothesize that such reduced cortisol breakdown may suppress pulsatile ACTH and cortisol secretion via feedback inhibition. To test this hypothesis, nocturnal ACTH and cortisol secretory profiles were constructed by deconvolution analysis from plasma concentration time series in 40 matched critically ill patients and eight healthy controls, excluding diseases or drugs that affect the hypothalamic-pituitary-adrenal axis. Blood was sampled every 10 min between 2100 and 0600 to quantify plasma concentrations of ACTH and (free) cortisol. Approximate entropy, an estimation of process irregularity, cross-approximate entropy, a measure of ACTH-cortisol asynchrony, and ACTH-cortisol dose-response relationships were calculated. Total and free plasma cortisol concentrations were higher at all times in patients than in controls (all P < 0.04). Pulsatile cortisol secretion was 54% lower in patients than in controls (P = 0.005), explained by reduced cortisol burst mass (P = 0.03), whereas cortisol pulse frequency (P = 0.35) and nonpulsatile cortisol secretion (P = 0.80) were unaltered. Pulsatile ACTH secretion was 31% lower in patients than in controls (P = 0.03), again explained by a lower ACTH burst mass (P = 0.02), whereas ACTH pulse frequency (P = 0.50) and nonpulsatile ACTH secretion (P = 0.80) were unchanged. ACTH-cortisol dose response estimates were similar in patients and controls. ACTH and cortisol approximate entropy were higher in patients (P ≤ 0.03), as was ACTH-cortisol cross-approximate entropy (P ≤ 0.001). We conclude that hypercortisolism during critical illness coincided with suppressed pulsatile ACTH and cortisol secretion and a normal ACTH-cortisol dose response. Increased irregularity and asynchrony of the ACTH and cortisol time series supported non-ACTH-dependent mechanisms driving hypercortisolism during critical illness.

Keywords: adrenocorticotropic hormone; cortisol; deconvolution analysis; intensive care; secretion.


Figures

Fig. 1.
Fig. 1.
Adrenocorticotropic hormone (ACTH) and total and free cortisol plasma concentrations. Plasma ACTH and total cortisol concentrations in 40 patients (dark gray) and 8 controls (light gray) are depicted at top and middle, with box plots representing medians and interquartile ranges. Plasma ACTH concentrations were lower in patients than controls from 0450 onward. Plasma total and free cortisol concentrations (bottom) were always higher in patients than controls. Free cortisol was calculated with the Coolens method after plasma cortisol-binding globulin (CBG) and albumin concentrations were determined at 2130, 2340, 0130, 0340, and 0530 (filled bars at bottom). From the average ratio, free cortisol/total cortisol and free cortisol concentrations were estimated for the other time points (dashed bars at bottom). P values for group comparisons were determined by the Wilcoxon rank sum test. For conversion of ACTH to units from the International System of Units (SI units; pmol/l), multiply by 0.22. For conversion of cortisol to SI units (nmol/l), multiply by 27.6.
Fig. 2.
Fig. 2.
Illustrative ACTH and cortisol profiles. Illustrative plasma ACTH and cortisol concentration time series obtained by blood sampling every 10 min from 2100 to 0600 in 1 patient (dark gray lines) and 1 control subject (light gray lines). Top: measured (continuous curves) and model-estimated (interrupted curves) plasma concentration profiles. Bottom: estimated instantaneous secretion rates. For conversion of ACTH to SI units (pmol/l), multiply by 0.22. For conversion of cortisol to SI units (nmol/l), multiply by 27.6.
Fig. 3.
Fig. 3.
ACTH and cortisol deconvolution results. A and E: pulsatile ACTH and cortisol secretion rates during the study period in patients (n = 40) and in control subjects (n = 8). B and F: mass per ACTH and cortisol burst. C and G: no. of ACTH and cortisol pulses. D and H: nonpulsatile ACTH and cortisol secretion rates during the study period. Boxes represent medians and interquartile ranges, and whiskers are 10th and 90th percentiles. P values for group comparisons were determined by the Wilcoxon rank sum test. For conversion of ACTH to SI units (pmol/l), multiply by 0.22. For conversion of cortisol to SI units (nmol/l), multiply by 27.6.
Fig. 4.
Fig. 4.
Approximate entropy (ApEn) and cross-ApEn for ACTH and cortisol system regularity. A and B: ApEn of the ACTH and cortisol time series, with high levels indicating higher system irregularity, in patients (n = 40) and in control subjects (n = 8). C: cross-ApEn from ACTH to cortisol, a marker of feedforward regulation. D: cross-ApEn from cortisol to ACTH, a marker of feedback regulation. Boxes represent medians, and interquartile ranges and whiskers are the 10th and 90th percentiles. P values for group comparisons were determined by the Wilcoxon rank sum test. E and F: positive correlation (black line) between plasma free cortisol concentrations and the 2 cross-ApEn parameters in patients (dark gray) and control subjects (light gray line). The positive correlation was maintained when analyzed among patients only (dark gray line). P values for correlation were determined by analysis of variance.

References

    1. Annane D, Sebille V, Charpentier C, Bollaert PE, Francois B, Korach JM, Capellier G, Cohen Y, Azoulay E, Troche G, Chaumet-Riffaud P, Bellissant E. Effect of treatment with low doses of hydrocortisone and fludrocortisone on mortality in patients with septic shock. JAMA 288: 862–871, 2002 - PubMed
    1. Boonen E, Vervenne H, Meersseman P, Andrew R, Mortier L, Declercq PE, Vanwijngaerden YM, Spriet I, Wouters PJ, Vander Perre S, Langouche L, Vanhorebeek I, Walker BR, Van den Berghe G. Reduced cortisol metabolism during critical illness. N Engl J Med 368: 1477–1488, 2013 - PMC - PubMed
    1. Bornstein SR. Predisposing factors for adrenal insufficiency. N Engl J Med 360: 2328–2339, 2009 - PubMed
    1. Bornstein SR, Chrousos GP. Clinical review 104: Adrenocorticotropin (ACTH)- and non-ACTH-mediated regulation of the adrenal cortex: neural and immune inputs. J Clin Endocrinol Metab 84: 1729–1736, 1999 - PubMed
    1. Bornstein SR, Engeland WC, Ehrhart-Bornstein M, Herman JP. Dissociation of ACTH and glucocorticoids. Trends Endocrinol Metab 19: 175–180, 2008 - PubMed

Publication types

LinkOut - more resources