. 2014 Feb 26:4:4187.
doi: 10.1038/srep04187.

Deep ocean carbonate ion increase during mid Miocene CO2 decline

Affiliations

Deep ocean carbonate ion increase during mid Miocene CO2 decline

Sev Kender et al. Sci Rep. .

Abstract

Characterised by long term cooling and abrupt ice sheet expansion on Antarctica ~14 Ma ago, the mid Miocene marked the beginning of the modern ice-house world, yet there is still little consensus on its causes, in part because carbon cycle dynamics are not well constrained. In particular, changes in carbonate ion concentration ([CO3(2-)]) in the ocean, the largest carbon reservoir of the ocean-land-atmosphere system, are poorly resolved. We use benthic foraminiferal B/Ca ratios to reconstruct relative changes in [CO3(2-)] from the South Atlantic, East Pacific, and Southern Oceans. Our results suggest an increase of perhaps ~40 μmol/kg may have occurred between ~15 and 14 Ma in intermediate to deep waters in each basin. This long-term increase suggests elevated alkalinity input, perhaps from the Himalaya, rather than other shorter-term mechanisms such as ocean circulation or ecological changes, and may account for some of the proposed atmospheric CO2 decline before ~14 Ma.


Figures

Figure 1
Figure 1. Global palaeogeographic map showing the continental configuration at 14 Ma.
The positions of ODP Sites discussed in this study are indicated as filled circles. Possible major sources of deep Northern Component Water (NCW), Southern Component Water (SCW), and Tethys-Indian Saline Water (TISW), are indicated by schematic arrows. Mollweid projection of modern continents (red) is shown on a palaeogeographic reconstruction, generated from, of continental plates (grey) centered at 14 Ma.
Figure 2
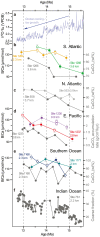
Figure 2. Summary of ocean carbonate proxies.
Deep-ocean B/Ca records (coloured symbols) compared with deep-ocean sedimentary CaCO3 data (grey symbols) and deep-ocean oxygen isotopes (blue line) over the interval ~15 to 13 Ma. Open symbols indicate probable interglacial samples. Increasing values of B/Ca and CaCO3 data indicates elevated bottom water [CO32−]. (a) Deep ocean δ18O from Site 1237, indicating long term cooling with the sharpest drop at ~13.8 Ma during the mid Miocene climate transition. (b) B/Ca with CaCO3 wt% data from the Walvis Ridge. (c) CaCO3 wt% data from the northern Mid-Atlantic Ridge. (d) B/Ca with CaCO3 accumulation rate data from the Nazca Ridge. (e) B/Ca with CaCO3 wt% data from the Tasmanian Margin and South Tasman Rise. (f) CaCO3 coarse fraction data from the Wombat Plateau.
Figure 3
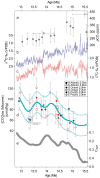
Figure 3. Composite seawater [CO32−] estimates against other mid Miocene climate records.
(a) Atmospheric CO2 reconstructed from planktonic foraminiferal δ11B (filled circles), and fossil leave stomatal frequency (open circles). (b) Deep ocean benthic foraminiferal δ18O from ODP Site 1237, indicating long term global cooling and ice-sheet expansion during the mid Miocene, and rapid cooling and ice sheet expansion at ~13.8 Ma. (c) Deep ocean δ13C from Site 1237. (d) Deep-ocean [CO32−] estimated from foraminiferal B/Ca data of several sites (Fig. 2), using estimates for mid Miocene B/Casw values and calculated palaeo-water depths (see Methods). Error largely associated with calibration uncertainty and possible changes to B/Casw due to continental weathering (see Methods). Blue symbols represent glacials, red interglacials, and green intermediate. Blue line is a best fit 5-point smoothing spline, with ±1s.d. of dataset (light blue). Circle indicates two samples that may have been affected by local oxygen minimum zone (OMZ) expansion. (e) Chemical weathering index from ODP Site 1148, South China Sea, as the ratio of chlorite/(chlorite + haematite + goethite) (CRAT). Lower values may represent increasing monsoon intensity over Southern China and associated intense weathering of the Himalaya. Other proxies (see Supplementary Information) indicate increased Himalayan weather and erosion during the mid Miocene.

References

    1. Holbourn A., Kuhnt W., Schultz M. & Erlenkeuser H. Impacts of orbital forcing and atmospheric carbon dioxide on Miocene ice-sheet expansion. Nature 438, 483–487 (2005). - PubMed
    1. Flower B. P. & Kennett J. P. The Middle Miocene climatic transition: East Antarctic ice sheet development, deep ocean circulation and global carbon cycling. Palaeogeogr. Palaeoclimatol. Palaeoecol. 108, 537–555 (1994).
    1. Holbourn A., Kuhnt W., Schultz M., Flores J.-A. & Anderson N. Orbitally-paced climate evolution during the middle Miocene “Monterey” carbon-isotope excursion. Earth Planet. Sci. Lett. 261, 534–550 (2007).
    1. Coxall H. K., Wilson P. A., Pälike H., Lear C. H. & Backman J. Rapid stepwise onset of Antarctic glaciation and deeper calcite compensation. Nature 433, 53–57 (2005). - PubMed
    1. Kennett J. P. & Barker P. F. Latest Cretaceous to Cenozoic climate and oceanographic developments in the Weddell Sea, Antarctica: an ocean-drilling perspective. Proc. Ocean Drill. Program Sci. Results 113, 937–960 (1990).

Publication types