. 2014 Mar 11;111(10):E888-95.
doi: 10.1073/pnas.1319944111. Epub 2014 Feb 25.

A frequent, GxxxG-mediated, transmembrane association motif is optimized for the formation of interhelical Cα-H hydrogen bonds

Affiliations

A frequent, GxxxG-mediated, transmembrane association motif is optimized for the formation of interhelical Cα-H hydrogen bonds

Benjamin K Mueller et al. Proc Natl Acad Sci U S A. .

Abstract

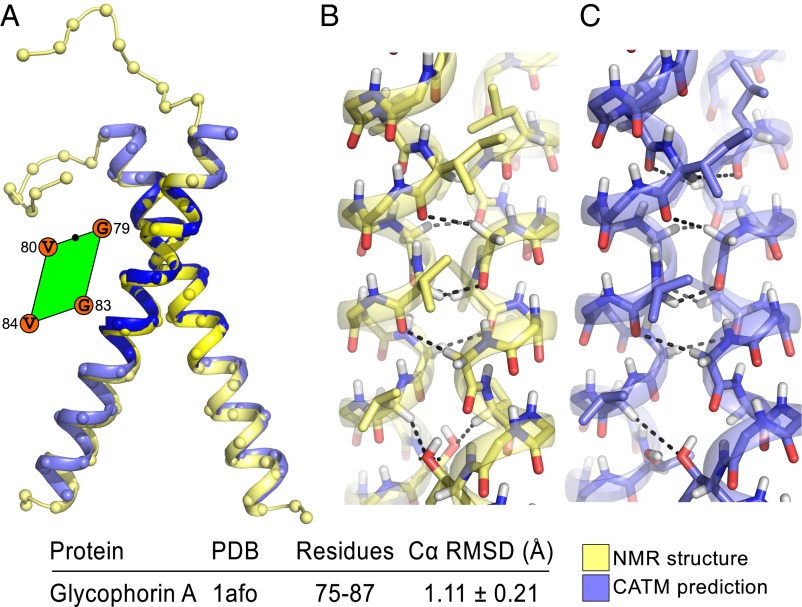
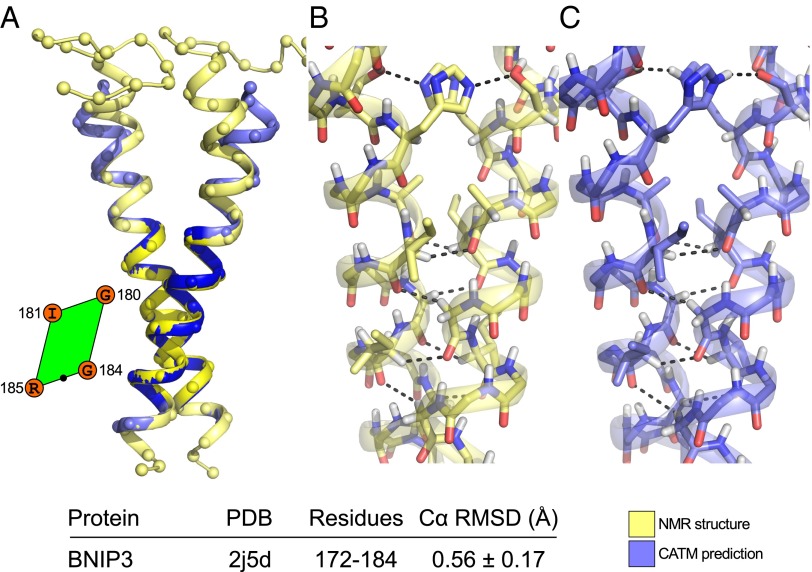
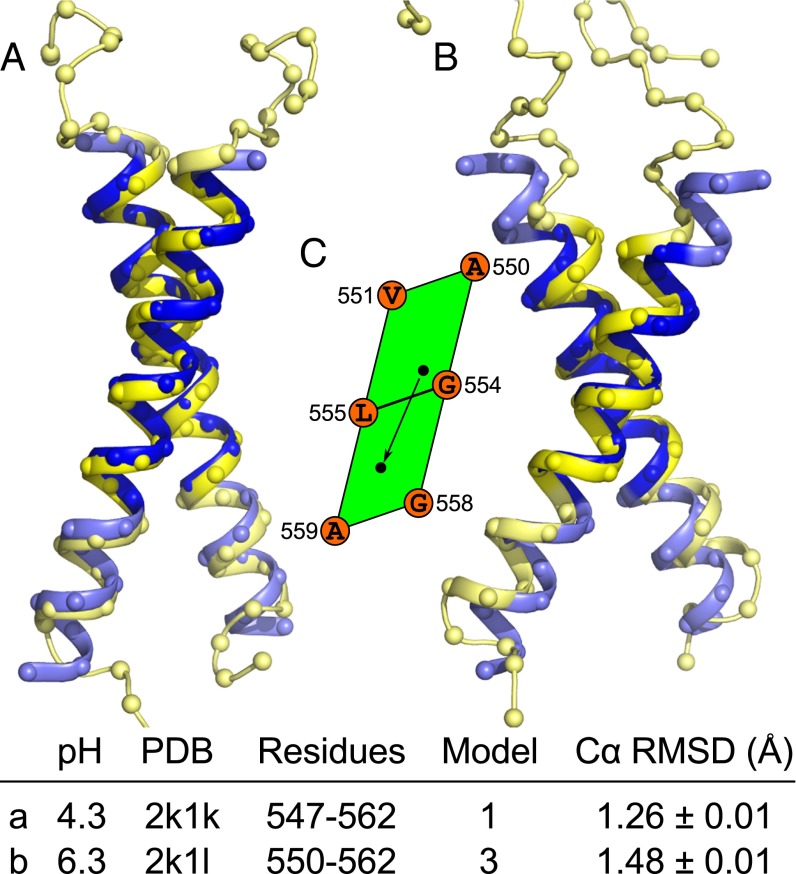
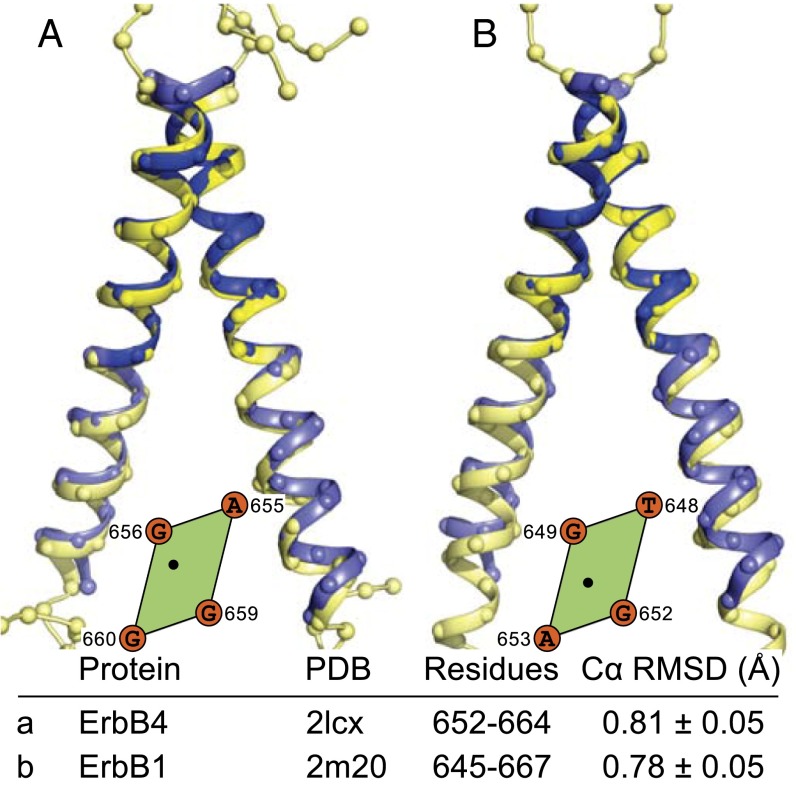
Carbon hydrogen bonds between Cα-H donors and carbonyl acceptors are frequently observed between transmembrane helices (Cα-H···O=C). Networks of these interactions occur often at helix-helix interfaces mediated by GxxxG and similar patterns. Cα-H hydrogen bonds have been hypothesized to be important in membrane protein folding and association, but evidence that they are major determinants of helix association is still lacking. Here we present a comprehensive geometric analysis of homodimeric helices that demonstrates the existence of a single region in conformational space with high propensity for Cα-H···O=C hydrogen bond formation. This region corresponds to the most frequent motif for parallel dimers, GASright, whose best-known example is glycophorin A. The finding suggests a causal link between the high frequency of occurrence of GASright and its propensity for carbon hydrogen bond formation. Investigation of the sequence dependency of the motif determined that Gly residues are required at specific positions where only Gly can act as a donor with its "side chain" Hα. Gly also reduces the steric barrier for non-Gly amino acids at other positions to act as Cα donors, promoting the formation of cooperative hydrogen bonding networks. These findings offer a structural rationale for the occurrence of GxxxG patterns at the GASright interface. The analysis identified the conformational space and the sequence requirement of Cα-H···O=C mediated motifs; we took advantage of these results to develop a structural prediction method. The resulting program, CATM, predicts ab initio the known high-resolution structures of homodimeric GASright motifs at near-atomic level.

Keywords: interaction motifs; protein prediction.


Conflict of interest statement

The authors declare no conflict of interest.

Figures

Fig. 1.
Fig. 1.
Carbon hydrogen bond formation has preferential regions in interhelical space. (A) Definition of four parameters that define the geometry of a symmetrical dimer: the interhelical distance d; the crossing angle θ; the rotation of the helix around its axis ω; and the vertical position Z of the point of closest approach between the two helical axes (the crossing point P). (B) The coordinates can be redefined by expressing them as a function of the unit cell (green) on the helical lattice that contains the point of closest approach P. (C) The same unit cell in a planar helical lattice. The four interfacial positions that surround the point of closest approach are designated as N1 (relative position i), N2 (i+1), C1(i+4), and C2 (i+5). The principal axes are the rotation along the helical screw (ω') and the vector between C2 and N2 (Z'). The mathematical relationship between (ω, Z) and (ω', Z') is provided in Fig. S1.
Fig. 2.
Fig. 2.
Position C1 must be a Gly for carbon hydrogen bond formation. A map of the carbon hydrogen bonding energy (Ehb, color bar) as a function of interhelical geometry (ω': x axis, θ: y axis; Z': panels). The amino acids at the interfacial positions (white circle A, Ala; blue circle G, Gly), are indicated in the unit cell schemes on the left. (A) Analysis of poly-Gly: A single broad minimum is observed centered around a region with a right-handed crossing angle θ of approximately −30° to −50°. The minimum persists with variation along the entire Z' stack. (BD) Poly-Ala sequences with a single Gly at specific positions as indicated on the left-hand side of the figure. The propensity to form hydrogen bonds is almost completely removed compared with poly-Gly unless the amino acid at position C1 is a Gly (D). (E) Introduction of a GxxxG motif at the positions N1 and C1 restores some of the low-energy regions for higher Z' values. (F) When a third Gly is added at C5, the propensity becomes very similar to poly-Gly. In each panel, the hydrogen bond energy (Ehb) is plotted at the interhelical distance (dmin) in which the overall energy (vdw + hbond) is minimized.
Fig. 3.
Fig. 3.
Structural distinction between interfacial positions. (A) The amino acids on the left side of the unit cell (N2 and C2) orient their α-hydrogen toward the interface while their Cβ points laterally, and thus these positions can accommodate larger amino acid types. The situation is reversed for positions N1 and C1: The α-hydrogen is oriented laterally, and the side chain points directly toward the opposing helix. Larger amino acids in this position may not be accommodated. (B) Gly is the only amino acid type that can form a hydrogen bond using the “side chain” hydrogen when present at positions N1 or C1. (C) Structural example: In this case the crossing point is close to C1, and there is sufficient space to allow Ala at N1.
Fig. 4.
Fig. 4.
In a GASright motif, the C1 and C2 donors are aligned with carbonyl acceptors at i, i+3 on the opposing helix. (A) Helical lattices highlighting the (Left) C1 and C2 donor positions (blue) and (Right) carbonyl acceptors at i, i+3 on the opposing helix (dark red). (B) A superimposition of the two lattices followed by a −40° rotation aligns the donors and acceptors. (C) Structural representation of the same alignment.
Fig. 5.
Fig. 5.
CATM prediction of the TM domain of Glycophorin A. (A) Backbone superimposition of the NMR structure (yellow) and the predicted model (blue). The Cα RMSD in the region that encompasses the interface is indicated and highlighted in darker blue and yellow in the ribbon. The amino acids at the interface (G, Gly, V, Val) and the position of the point of closest approach (black dot) are highlighted in the parallelogram. B and C show the full-atom comparison between the experimental structure and the prediction. The CATM model is close to atomic precision, with a similar network of carbon hydrogen bonds. The NMR structure and CATM model differ in the orientation of Thr-87, which hydrogen bonds to its own backbone, whereas CATM predicts the formation of an interhelical canonical hydrogen bond.
Fig. 6.
Fig. 6.
Structural prediction of BNIP3. CATM produces a single model for BNIP3 that is extremely similar to the NMR structure. (A) The Cα RMSD of the helical region of the entire TM domain is 1.10 ± 0.36 Å, which falls to 0.56 ± 0.17 Å when only the region in contact (darker blue and yellow) is considered. The amino acids at the interface and the position of the point of closest approach (black dot) are highlighted in the parallelogram. The side-by-side prediction (B and C) shows close similarity in the network of carbon hydrogen bonds and correct prediction of the orientation of all interfacial side chains. The model also accurately captures the canonical hydrogen bond between Ser-172 and His-173.
Fig. 7.
Fig. 7.
CATM predicts multiple states of the EphA1 Tyrosine Receptor Kinase. (A) The structure of the TM domain EphA1 determined at a low pH is well predicted by CATM model 1. (B) The structure obtained at higher pH is matched by model 4. (C) The conformational shift between low and high pH is highlighted schematically in the unit cell representation. The interface remains centered on the Gly-zipper motif (AxxxGxxxG), but the crossing point shifts (arrow) toward the C terminus in the adjacent unit cell. There is also an increase of the crossing angle. EphA1 has multiple GxxxG-like motifs and produces four models. Model 2 interacts through a C-terminal AxxxG motif. Model 3 is closely related to model 1.
Fig. 8.
Fig. 8.
Prediction of ErbB4 and ErbB1. (A) ErbB4 is predicted by the top CATM model, and (B) ErbB1 (EGFR) is predicted by the third model. Among the five structures tested, ErbB1 is the only structure that is not predicted by the lowest-energy model.

Similar articles

Cited by

References

    1. Moore DT, Berger BW, DeGrado WF. Protein-protein interactions in the membrane: Sequence, structural, and biological motifs. Structure. 2008;16(7):991–1001. - PMC - PubMed
    1. Walters RFS, DeGrado WF. Helix-packing motifs in membrane proteins. Proc Natl Acad Sci USA. 2006;103(37):13658–13663. - PMC - PubMed
    1. Senes A, Ubarretxena-Belandia I, Engelman DM. The Calpha ---H...O hydrogen bond: A determinant of stability and specificity in transmembrane helix interactions. Proc Natl Acad Sci USA. 2001;98(16):9056–9061. - PMC - PubMed
    1. Senes A, Gerstein M, Engelman DM. Statistical analysis of amino acid patterns in transmembrane helices: The GxxxG motif occurs frequently and in association with beta-branched residues at neighboring positions. J Mol Biol. 2000;296(3):921–936. - PubMed
    1. Lomize MA, Lomize AL, Pogozheva ID, Mosberg HI. OPM: Orientations of Proteins in Membranes database. Bioinformatics. 2006;22(5):623–625. - PubMed

Publication types

MeSH terms