. 2014 Apr 11;289(15):10620-10636.
doi: 10.1074/jbc.M113.525626. Epub 2014 Feb 25.

Bifunctional homodimeric triokinase/FMN cyclase: contribution of protein domains to the activities of the human enzyme and molecular dynamics simulation of domain movements

Affiliations

Bifunctional homodimeric triokinase/FMN cyclase: contribution of protein domains to the activities of the human enzyme and molecular dynamics simulation of domain movements

Joaquim Rui Rodrigues et al. J Biol Chem. .

Abstract

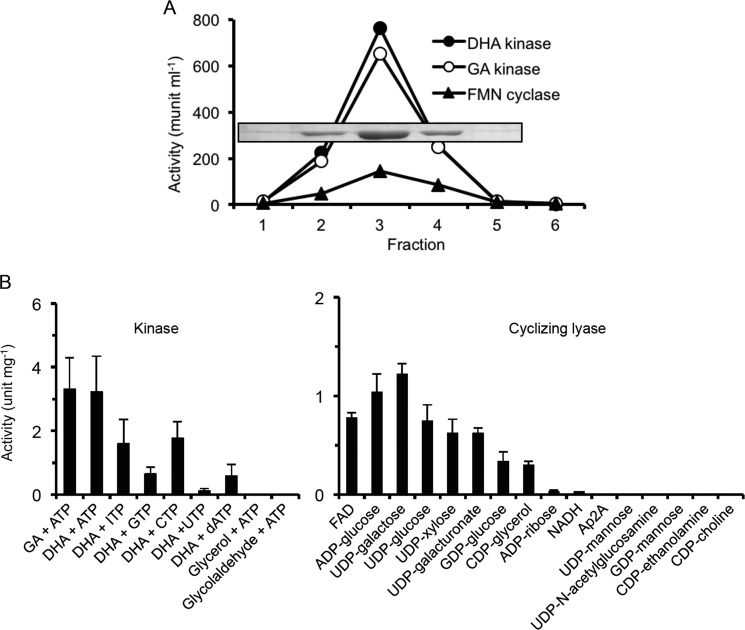
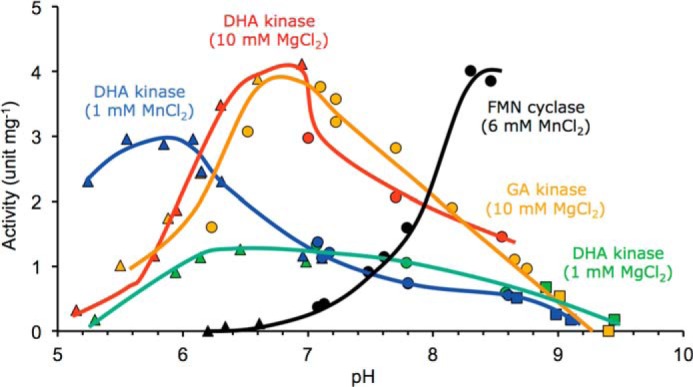
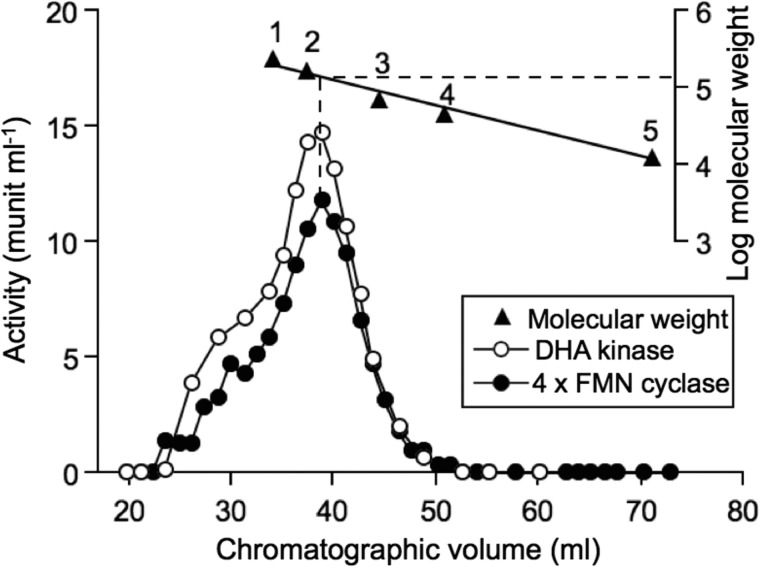
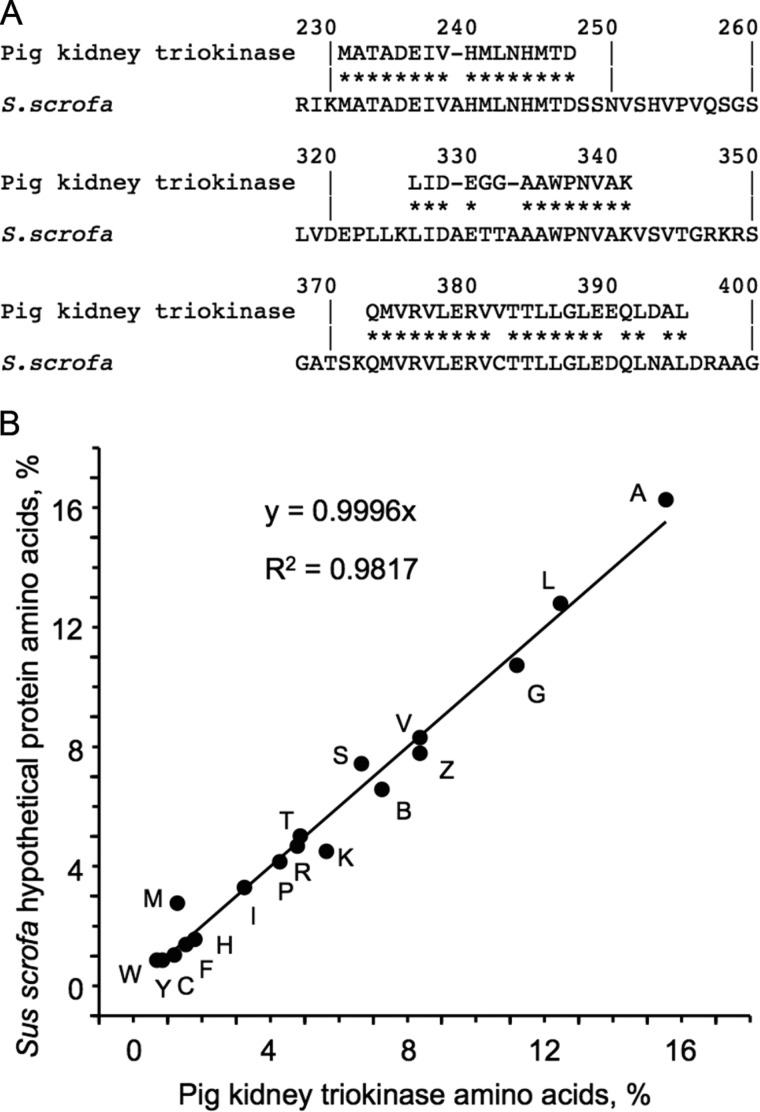
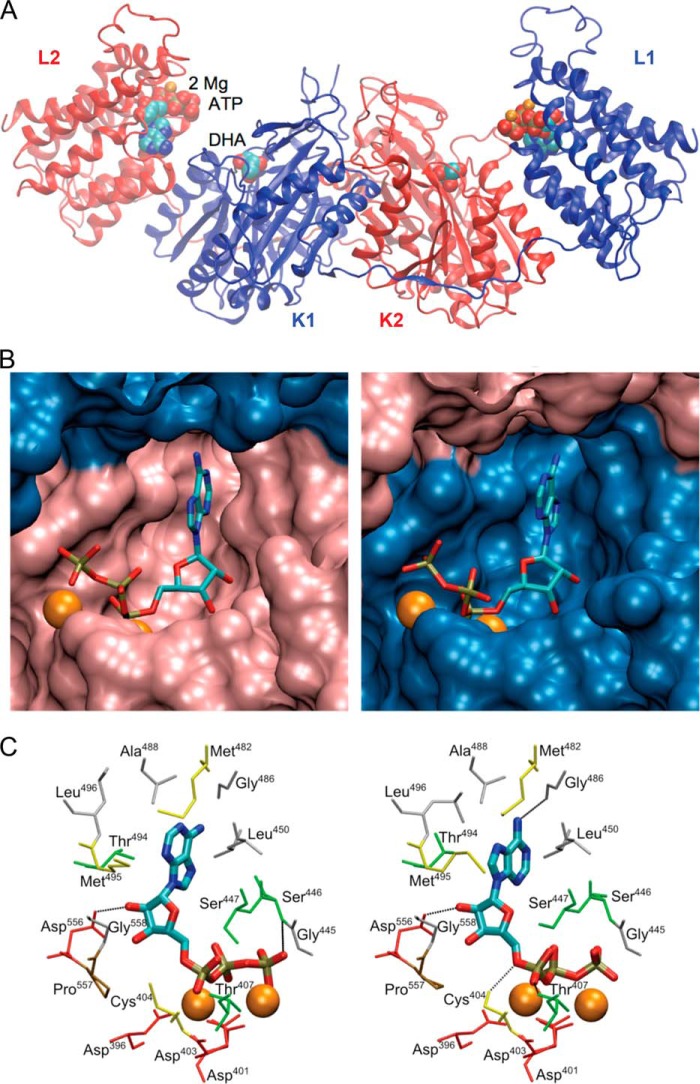
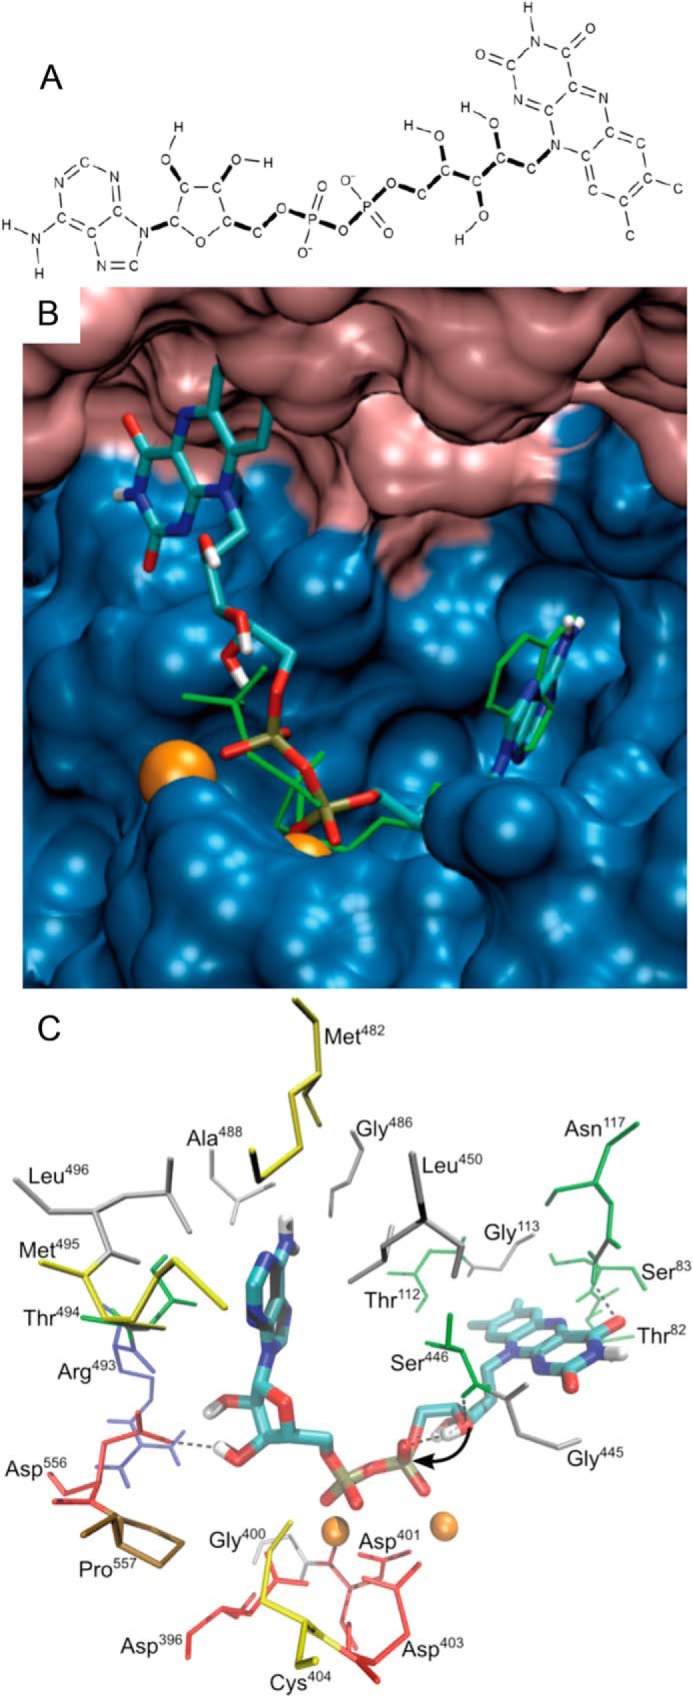
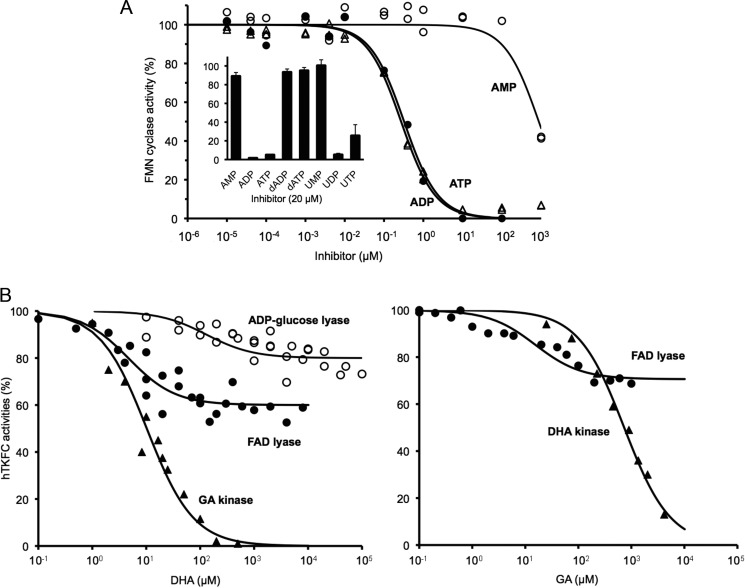
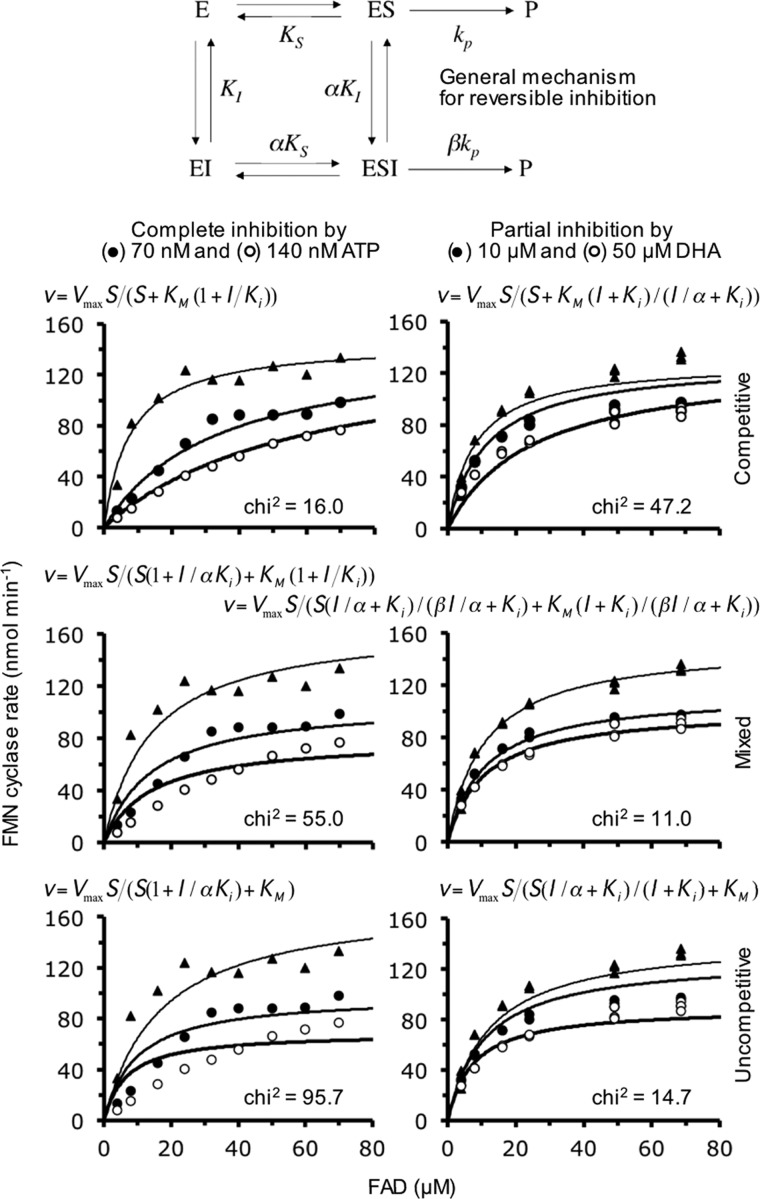
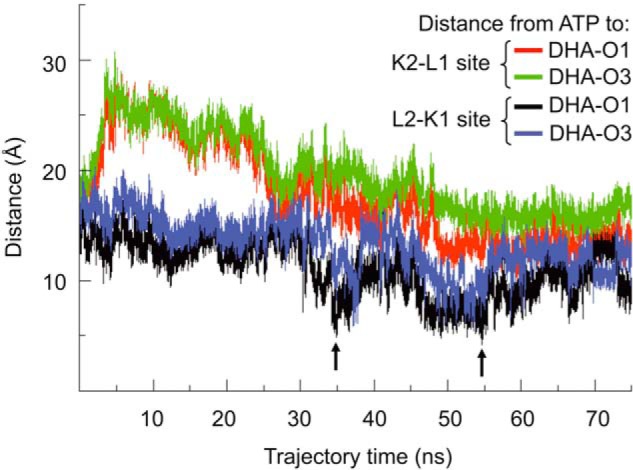
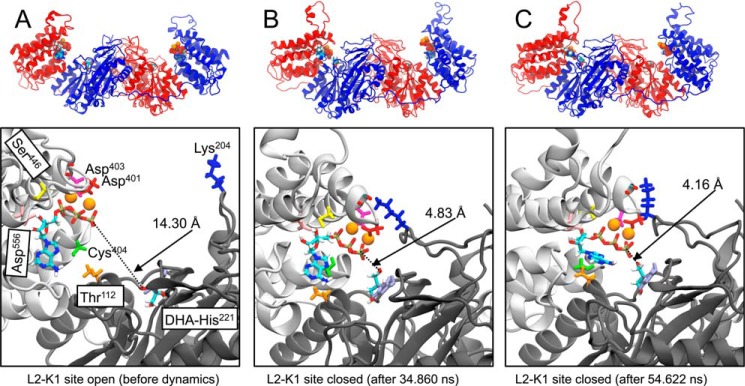
Mammalian triokinase, which phosphorylates exogenous dihydroxyacetone and fructose-derived glyceraldehyde, is neither molecularly identified nor firmly associated to an encoding gene. Human FMN cyclase, which splits FAD and other ribonucleoside diphosphate-X compounds to ribonucleoside monophosphate and cyclic X-phosphodiester, is identical to a DAK-encoded dihydroxyacetone kinase. This bifunctional protein was identified as triokinase. It was modeled as a homodimer of two-domain (K and L) subunits. Active centers lie between K1 and L2 or K2 and L1: dihydroxyacetone binds K and ATP binds L in different subunits too distant (≈ 14 Å) for phosphoryl transfer. FAD docked to the ATP site with ribityl 4'-OH in a possible near-attack conformation for cyclase activity. Reciprocal inhibition between kinase and cyclase reactants confirmed substrate site locations. The differential roles of protein domains were supported by their individual expression: K was inactive, and L displayed cyclase but not kinase activity. The importance of domain mobility for the kinase activity of dimeric triokinase was highlighted by molecular dynamics simulations: ATP approached dihydroxyacetone at distances below 5 Å in near-attack conformation. Based upon structure, docking, and molecular dynamics simulations, relevant residues were mutated to alanine, and kcat and Km were assayed whenever kinase and/or cyclase activity was conserved. The results supported the roles of Thr(112) (hydrogen bonding of ATP adenine to K in the closed active center), His(221) (covalent anchoring of dihydroxyacetone to K), Asp(401) and Asp(403) (metal coordination to L), and Asp(556) (hydrogen bonding of ATP or FAD ribose to L domain). Interestingly, the His(221) point mutant acted specifically as a cyclase without kinase activity.

Keywords: Bifunctional Kinase/Cyclase; Cyclic FMN; DAK Gene; Dihydroxyacetone Phosphorylation; FAD; Fructose Metabolism; Glyceraldehyde Phosphorylation; Molecular Docking; Molecular Dynamics; Mutagenesis, Site-specific.


Figures

FIGURE 1.
FIGURE 1.
Triokinase and cyclizing lyase activities of hTKFC. A, coexpression of GA kinase with DHA kinase and FMN cyclase activities in BL21 cells transformed with plasmid pGEX-6P-3-hF2 that encodes a GST-human DHA kinase/FMN cyclase fusion protein (24). The lysate supernatant was chromatographed on a GSH-Sepharose column to which the GST-labeled protein adsorbed. The recombinant protein was eluted from the column after an overnight incubation with PreScission protease. In the fractions collected, the three enzyme activities shown were assayed, and the presence of the recombinant 60-kDa protein band composed of the 575 amino acids of human DHA kinase/FMN cyclase plus an N-terminal extension of 11 amino acids left by the cut with PreScission was detected by SDS-PAGE. B, substrate specificity of the kinase and cyclizing lyase activities. Activity with S.D. (error bars) is the mean of three experiments, each performed with two different amounts of enzyme evaluated either by continuous spectrophotometric recording (kinase) or by HPLC at three time points (cyclizing lyase) under conditions of linear response with respect to incubation time and hTKFC amount. Kinase activities were assayed with 0.5 mm phosphoryl acceptor, 5 mm (deoxy)nucleoside triphosphate donor, and 10 mm MgCl2. Cyclizing lyase activities were assayed with 0.5 mm substrate and 6 mm MnCl2. Ap2A, diadenosine pyrophosphate.
FIGURE 2.
FIGURE 2.
Activity-versus-pH profiles of the triokinase and FMN cyclase activities of hTKFC. The activities were measured by the standard assays at the MgCl2 or MnCl2 concentrations and the pH values indicated. The buffers used were either Tris acetate (pH ≤ 7), Tris-HCl (pH 7–8.8), or CAPS-NaOH (pH > 8.8). The pH values were directly measured with a glass electrode in mixtures like those used for activity assays.
FIGURE 3.
FIGURE 3.
Dimeric molecular weight of native hTKFC. A 0.75-ml hTKFC sample was applied to an 87.5 × 1.2-cm Sephadex G-150 column equilibrated with 20 mm Tris-HCl, 0.5 mm EDTA, and 0.1 m KCl adjusted to pH 8.2 at 4 °C. The chromatography was run at 0.1 ml min−1 in the same buffer. Fractions were collected and weighed for precise volume determination, and DHA kinase and FMN cyclase activities were assayed. The column was calibrated with the following molecular weight standards: 1, catalase (240,000); 2, aldolase (158,000; 3, bovine serum albumin (66,000); 4, egg albumin (45,000); and 5, cytochrome c (12,400). This gel filtration experiment indicated an apparent molecular weight of 140,000 for native hTKFC with additional evidence for the formation of higher order aggregates. When compared with the monomeric mass of 60 kDa, the apparent molecular weight of the native protein is in agreement with the expected behavior of an elongated dimer like hTKFC forms (Fig. 5).
FIGURE 4.
FIGURE 4.
Comparison of pig kidney triokinase and the hypothetical protein identified as the swine ortholog of hTKFC. A, ClustalW alignment of three lysyl endopeptidase peptides sequenced from triokinase purified from pig kidney (65) with the hypothetical S. scrofa protein XP_003122689. The asterisks mark identical amino acids. The numbering corresponds to the S. scrofa protein. B, comparison of the amino acid composition of pig kidney triokinase (65) with that of the hypothetical S. scrofa protein. Amino acids are identified by the single letter code (B, Asn or Asp; Z, Glu or Gln). The linear regression equation and the regression coefficient are shown within the graph.
FIGURE 5.
FIGURE 5.
Theoretical model of dimeric hTKFC with kinase substrates bound. The homodimeric model of hTKFC with bound DHA, ATP, and two Mg2+ ions per active site was constructed with Modeler using two Citrobacter sp. ATP-dependent DHA kinase structures as templates. The file describing the full model is available as supplemental File 3 (hTKFC_2DHA_2ATP.pdb). In the figure, the point of view and the orientation of the model are different in each panel. A, schematic representation of the complete model. B, detail of ATP bound in the L2-K1 (left) and K2-L1 (right) active sites. C, detail of amino acids near the Mg2+ ions and ATP.
FIGURE 6.
FIGURE 6.
FAD docked to the K2-L1 active site of hTKFC. Docking to the L2-K1 and K2-L1 sites was modeled with AutoDock with good results only in the second case (see further details in the main text). The file describing the full model is available as supplemental File 4 (hTKFC_FAD.pdb). A, FAD structure used for docking. Thick bonds correspond to active torsions; i.e. they were allowed to rotate during docking. Only polar hydrogens are shown. B, FAD docked to the K2-L1 site shown in overlap with (green rods) the ATP bound to the same site as it appears in the right-hand side of Fig. 5B. C, detail of amino acids near the bound 2Mg2+-FAD. The curved arrow indicates the internal attack by the ribityl 4′-oxygen atom over the proximal phosphorus atom in the FMN cyclase reaction.
FIGURE 7.
FIGURE 7.
Inhibitors of the activities of hTKFC. A, inhibition of the FMN cyclase activity by adenosine phosphates and analogs. FMN cyclase was assayed with 50 μm substrate and the indicated concentrations of inhibitors under otherwise standard conditions. The inset shows percent activities determined in the presence of a fixed 20 μm concentration of the compound indicated. Error bars represent S.D. B, inhibition by trioses. Cyclizing lyase activities were assayed as in A, and the kinase activities were assayed with 500 μm GA (GA kinase) or 25 μm DHA (DHA kinase) and the indicated concentrations of inhibitors under otherwise standard conditions. The lines are best fits of the model equations for the partial pure noncompetitive (cyclizing lyase) or the complete competitive inhibition (kinase activities) (see Fig. 8).
FIGURE 8.
FIGURE 8.
Kinetic analyses of FMN cyclase inhibition by ATP and DHA. FAD saturation curves of the cyclizing lyase activity of hTKFC were obtained in the absence of inhibitors and in the presence of either ATP (complete FMN cyclase inhibitor; Fig. 7A) or DHA (partial FMN cyclase inhibitor; Fig. 7B) as indicated. The kinetic analyses were based on the general mechanism for reversible inhibition (top scheme) and on the model equations describing the competitive, general noncompetitive or mixed, and uncompetitive inhibitions either complete or partial (84, 85). In these equations, under the assumptions of rapid equilibrium, Km approximates KS. The equations were adjusted to the two data sets by simultaneous adjustment to the three curves of each data set using the Solver function of Microsoft Excel (global fit). The parameters left to fluctuate during the adjustments were Vmax, Km, Ki, α, and β whenever relevant. The goodness of fit was estimated by the χ2 parameter (85), which supported that inhibition by ATP was of the complete competitive type and inhibition by DHA was a partial mixed inhibition; however, because for the latter the best adjustment returned an α value close to the unit (α = 0.92), DHA inhibition can be assumed to be a partial inhibition of the classical pure noncompetitive type (i.e. an inhibition in which the presence of the inhibitor affects the apparent Vmax but not the apparent Km value).
FIGURE 9.
FIGURE 9.
ATP-to-DHA distances in the two hTKFC active sites along the simulation of a molecular dynamics trajectory. A 75-ns molecular dynamics simulation was run in Gromacs with the Amber03 force field starting with the hTKFC-2DHA-2ATP complex constructed with Modeler (Fig. 5). The simulation covered a trajectory composed of 75,000 frames collected at intervals of 1 ps (see the supplemental movie (hTKFC_2DHA_2ATP_MD.mpg)). In the frames, the distances to each DHA O1 and O3 atoms were measured from the γ-phosphorus atom of ATP bound to the same active site. The arrows mark the relative minima of ATP-to-DHA distance, 4.83 and 4.16 Å, both recorded at the L2-K1 site in the frames corresponding to 34.860 and 54.622 ns, respectively (shown in Fig. 10, B and C).
FIGURE 10.
FIGURE 10.
Conformations of hTKFC before dynamics and upon reaching two relative minima of ATP-to-DHA distance in the L2-K1 active site during the molecular dynamics simulation. Upper panels, schematic models of the conformations of hTKFC-2DHA-2ATP model before dynamics (see Fig. 5) (A) and the frames corresponding to the 34.860 (B) and 54.622 ns (C) of the molecular dynamics trajectory (marked by arrows in Fig. 9). Lower panels, detail of the L2-K1 site in the same models. The discontinuous lines mark the distances between the DHA O1 and the γ-phosphorus atom of ATP. In the left lower panel, the positions of the amino acids submitted to site-directed mutagenesis are also shown.
FIGURE 11.
FIGURE 11.
Comparison of the closed conformations of the L2-K1 site of hTKFC with the DhaK-DhaL complex of E. coli. Domains K1 (blue) and L2, including the L2-K2 linker (red), of the three hTKFC conformations of Fig. 10 are here shown in overlap with the DhaK (cyan) and DhaL (orange) subunits of the E. coli DhaK-DhaL complex. To emphasize the different relative orientations of L2 toward K1 and DhaL toward DhaK either in the open (A) or closed (B and C) hTKFC conformations, the K1 domain was structurally aligned with DhaK in each case.

References

    1. Hers H. G., Kusaka T. (1953) The metabolism of fructose-1-phosphate in the liver. Biochim. Biophys. Acta 11, 427–437 - PubMed
    1. Sillero M. A., Sillero A., Sols A. (1969) Enzymes involved in fructose metabolism in liver and the glyceraldehyde metabolic crossroads. Eur. J. Biochem. 10, 345–350 - PubMed
    1. Mayes P. A. (1993) Intermediary metabolism of fructose. Am. J. Clin. Nutr. 58, 754S–765S - PubMed
    1. Burns S. P., Murphy H. C., Iles R. A., Bailey R. A., Cohen R. D. (2000) Hepatic intralobular mapping of fructose metabolism in the rat liver. Biochem. J. 349, 539–545 - PMC - PubMed
    1. Steinmann B., Gitzelmann R., Van den Berghe G. (2001) in The Metabolic and Molecular Basis of Inherited Disease (Scriver C., Beaudet A., Sly W., Valle D., Childs B., Vogelstein B., eds) 8th Ed., pp. 1489–1520, McGraw-Hill, New York

Publication types

MeSH terms