. 2014 Apr 4;289(14):9730-40.
doi: 10.1074/jbc.M113.538041. Epub 2014 Feb 25.

Developmental regulation of synthesis and dimerization of the amyloidogenic protease inhibitor cystatin C in the hematopoietic system

Affiliations

Developmental regulation of synthesis and dimerization of the amyloidogenic protease inhibitor cystatin C in the hematopoietic system

Yuekang Xu et al. J Biol Chem. .

Abstract

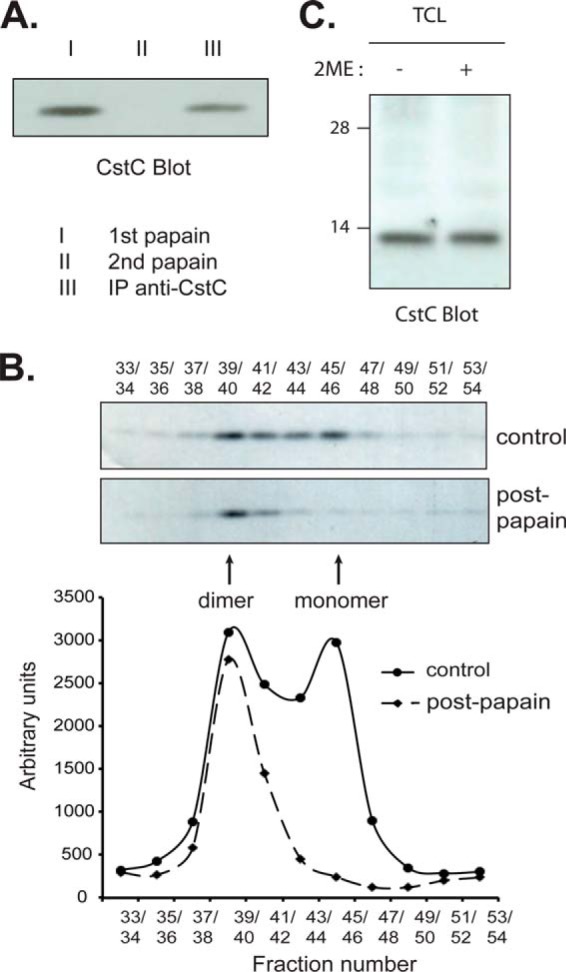
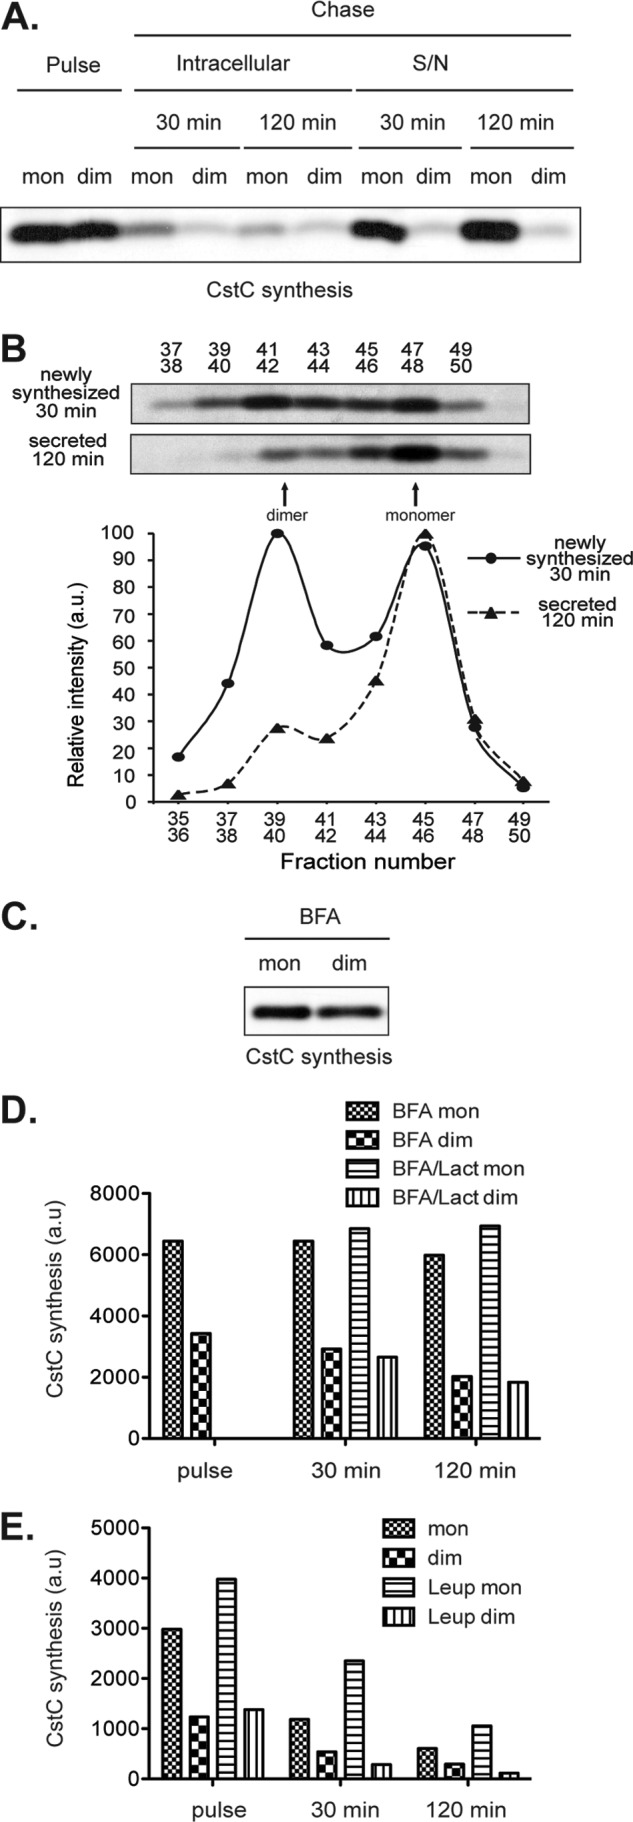
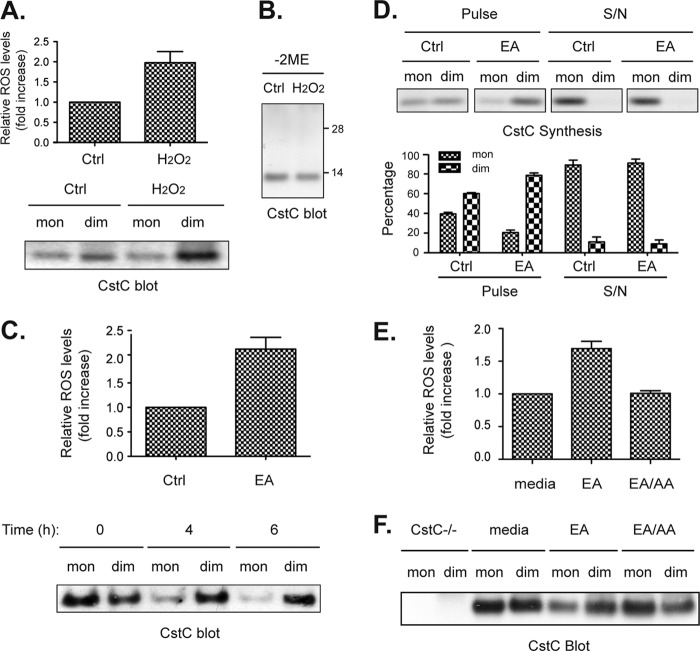
The cysteine protease inhibitor cystatin C is thought to be secreted by most cells and eliminated in the kidneys, so its concentration in plasma is diagnostic of kidney function. Low extracellular cystatin C is linked to pathologic protease activity in cancer, arthritis, atherosclerosis, aortic aneurism, and emphysema. Cystatin C forms non-inhibitory dimers and aggregates by a mechanism known as domain swapping, a property that reportedly protects against Alzheimer disease but can also cause amyloid angiopathy. Despite these clinical associations, little is known about the regulation of cystatin C production, dimerization, and secretion. We show that hematopoietic cells are major contributors to extracellular cystatin C levels in healthy mice. Among these cells, macrophages and dendritic cells (DC) are the predominant producers of cystatin C. Both cell types synthesize monomeric and dimeric cystatin C in vivo, but only secrete monomer. Dimerization occurs co-translationally in the endoplasmic reticulum and is regulated by the levels of reactive oxygen species (ROS) derived from mitochondria. Drugs or stimuli that reduce the intracellular concentration of ROS inhibit cystatin C dimerization. The extracellular concentration of inhibitory cystatin C is thus partly dependent on the abundance of macrophages and DC, and the ROS levels. These results have implications for the diagnostic use of serum cystatin C as a marker of kidney function during inflammatory processes that induce changes in DC or macrophage abundance. They also suggest an important role for macrophages, DC, and ROS in diseases associated with the protease inhibitory activity or amyloidogenic properties of cystatin C.

Keywords: Amyloidosis; Dendritic Cells; Macrophages; Protease Inhibitor; Protein Folding; Reactive Oxygen Species (ROS); Vascular Angiopathy.


Figures

FIGURE 1.
FIGURE 1.
Contribution of bone marrow-derived cells to the serum levels of Cst C. A–C, wild-type (CstC+/+) or cystatin C knock-out (CstC−/−) mice were reconstituted with wild-type or cystatin C-deficient BM as indicated by the arrows. The total splenocytes (A) or blood (B and C) of the reconstituted mice were examined for cystatin C contents by Western blot (A) or ELISA (B and C). Blood samples from cystatin C knock-out mice were included as negative control. ELISA results are presented as average values of duplicates from eight (B) or three (C) mice per group. Error bars represent S.E., and n.d. indicates not detected. **, p < 0.01. D, total cell lysates from purified splenic cell populations as indicated, or DC or macrophages generated in culture from BM precursors (BM-MΦ, BM-DC) were run in SDS-PAGE and their cystatin C contents were examined by Western blot. The same membrane was probed with anti-Actin antibody as loading control. E, purified cell populations as indicated were metabolically labeled and newly synthesized cystatin C was immunoprecipitated from cell lysates (lanes C) or the culture supernatant (lanes S), visualized by autoradiography and quantitated in a phosphorimager. All results are representative of two (MΦ) or multiple (DC) independent experiments performed.
FIGURE 2.
FIGURE 2.
Primary DC contain inactive cystatin C dimers. A, lysates of freshly isolated splenic CD8+ DC were incubated with immobilized, carboxymethylated (proteolytically inactive) papain to precipitate active cystatin C (I). A saturating amount of papain was used as confirmed by the lack of additional cystatin C recovered during a second round of precipitation with the same reagent (II). Remaining (inactive) cystatin C was retrieved by immunoprecipitation using an anti-cystatin C rabbit serum (III). Both the papain-reactive and inactive fractions of cystatin C were run in SDS-PAGE and visualized by Western blot. B, lysate of DC as above was either left untreated (control, upper gel) or incubated with carboxymethylated papain to deplete the active cystatin C (Post-papain, lower gel) before gel filtration chromatography. Cystatin C was retrieved from the fractions by immunoprecipitation using an anti-cystatin C rabbit serum. The immunoprecipitates were separated by 11.5% SDS-PAGE, and cystatin C was visualized by Western blot. The results were quantitated by densitometry (bottom graph). C, total cell lysates (TCL) of CD8+ DC were mixed with sample buffer lacking (−) or containing (+) 2-mercaptoethanol (2ME) as a reducing agent, fractionated by SDS-PAGE and analyzed by Western blot to detect cystatin C. All results are representative of two to three independent experiments.
FIGURE 3.
FIGURE 3.
Cystatin C dimerizes in the ER, but is mostly secreted as monomers. A, newly synthesized proteins from splenic CD8+ DC were metabolically labeled with [35S]Met/Cys. The cells were equally divided into pulsed and chased samples. The pulsed samples were lysed immediately, whereas the chased samples were incubated for the indicated times before lysis. Cystatin C monomer (mon) and dimer (dim) from either cell lysates (intracellular) or cell culture supernatants (S/N) were retrieved by precipitation with immobilized papain and then by immunoprecipitation with anti-cystatin C serum, respectively. The immunoprecipitates were fractionated by SDS-PAGE, and revealed by autoradiography. B, freshly isolated CD8+ DC were treated as in A. Cell lysates from pulsed samples (top gel) or culture supernatants after a 120-min chase (bottom gel) were fractionated by gel-filtration chromatography. Cystatin C was retrieved from the fractions by immunoprecipitation using an anti-cystatin C rabbit serum. The immunoprecipitates were separated by 11.5% SDS-PAGE and cystatin C was visualized by autoradiography. The band intensities were quantitated in a phosphorimager (bottom graph). C, newly synthesized proteins from splenic CD8+ DC were metabolically labeled with 35S in the presence of the ER-Golgi protein transport inhibitor BFA, and cystatin C was retrieved as in A (pulse). D, Splenic CD8+ DC were metabolically labeled in the presence of BFA and chased in the presence of BFA plus, where indicated, the proteasome inhibitor Lactacystin (Lact). Papain-reactive monomers and non-reactive dimers were immunoprecipitated and run in SDS-PAGE as in A. The amount of radioactive cystatin C in each lane was quantitated in a phosphorimager. E, as in D, but cells were pulsed without drugs and chased in the presence or absence of leupeptin. All results are representative of three or more independent experiments performed.
FIGURE 4.
FIGURE 4.
Intracellular ROS levels correlate with cystatin C dimerization. A, macrophages (MΦ) or DC generated in vitro from BM precursors were lysed and cystatin C was precipitated with carboxymethylated papain followed by immunoprecipitation with anti-cystatin C serum as described in the legend to Fig. 2A. The samples were fractionated in SDS-PAGE and cystatin C detected by Western blot. B, cystatin C monomer and dimer synthesis and secretion by MΦ was analyzed as described for DC in the legend to Fig. 3A. C, macrophages and DC were loaded with the cell-permeable, redox-sensitive dye CM-H2DCFDA (5- (and 6-)chloromethyl 2′,7′-dichlorodihydrofluorescein diacetate), and their intracellular ROS levels were examined by flow cytometry. The graph shows the mean fluorescence intensity (MFI) in the FITC channel. The data are presented as the mean ± S.E. of three independent experiments performed. D, the intracellular ROS levels in CD8+ DC freshly isolated from spleens (immature), or in their counterparts cultured overnight (mature), were measured by FACS. E, lysates of purified immature (left) and mature (right) CD8+ DC were fractionated by gel filtration chromatography. Cystatin C was immunoprecipitated from the fractions, run in SDS-PAGE, visualized by Western blot, and quantitated by densitometry (bottom graphs). F, lysates of mature CD8+ DC were analyzed as described in the legend to Fig. 2A to retrieve cystatin C monomer (papain-binding) and dimer (sequentially immunoprecipitated with anti-cystatin C serum). G, mature CD8+ DC were metabolically labeled/chased, and processed as described in the legend to Fig. 3B to measure cystatin C monomer and dimer synthesis and secretion. All results are representative of two to three independent experiments performed.
FIGURE 5.
FIGURE 5.
Intracellular ROS from mitochondria promote cystatin C dimerization. A, DC generated in vitro from BM precursors (BM-DC) were incubated with or without the oxidant H2O2 (0.8 mm) for 30 min. ROS levels in the cells were measured by flow cytometry (upper panel) and cystatin C monomers (papain-binding) and dimers (non-binding) were retrieved from cell lysates as described in the legend to Fig. 2A. The data in the histogram shows the mean ± S.E. (n = 3). B, total cell lysates of the H2O2-treated samples were analyzed by non-reducing SDS-PAGE and Western blot. C, BM-DC were incubated at 37 °C with or without the antioxidant-depleting agent EA at 60 μm. Intracellular ROS levels were measured by flow cytometry (upper panel) and cystatin C monomers and dimers were retrieved and visualized by Western blot (lower panel) as in A. D, BM-DC were pulsed chased as described in the legend to Fig. 3A but in the presence or absence of 60 mm EA. Cystatin C monomers and dimers were retrieved from cell lysates after the pulse, and from the culture supernatant after the chase (S/N) as indicated. Newly synthesized cystatin C was visualized by autoradiography. The result is representative of two independent experiments. The intensity of the bands containing cystatin C in the two independent experiments were quantitated by densitometry and shown as mean ± S.E. (bottom graphs). E, BM-DC were either left untreated or treated with 60 μm EA, or 60 μm EA plus 50 nm mitochondria respiration chain complex inhibitor AA in triplicates before they were harvested and loaded with redox sensitive dye to check for intracellular ROS levels by flow cytometry. The data shows the mean ± S.E., which is representative of two independent experiments. F, BM-DC were lysed and their intracellular cystatin C species examined by Western blot as in C. BM-DC from cystatin C-deficient mice (CstC−/−) were included as negative control. All results are representative of two (A, B, D, and E), three (F), or five (C) independent experiments performed.

Similar articles

Cited by

References

    1. Abrahamson M., Alvarez-Fernandez M., Nathanson C. M. (2003) Cystatins. Biochem. Soc. Symp. 70, 179–199 - PubMed
    1. Keppler D. (2006) Towards novel anti-cancer strategies based on cystatin function. Cancer Lett 235, 159–176 - PubMed
    1. Shi G. P., Sukhova G. K., Grubb A., Ducharme A., Rhode L. H., Lee R. T., Ridker P. M., Libby P., Chapman H. A. (1999) Cystatin C deficiency in human atherosclerosis and aortic aneurysms. J. Clin. Invest. 104, 1191–1197 - PMC - PubMed
    1. Liu J., Sukhova G. K., Sun J. S., Xu W. H., Libby P., Shi G. P. (2004) Lysosomal cysteine proteases in atherosclerosis. Arterioscler. Thromb. Vasc. Biol. 24, 1359–1366 - PubMed
    1. Rokadia H. K., Agarwal S. (2012) Serum cystatin C and emphysema: results from the National Health and Nutrition Examination Survey (NHANES). Lung 190, 283–290 - PubMed

Publication types

MeSH terms