. 2014 Feb 7:5:74.
doi: 10.3389/fpsyg.2014.00074. eCollection 2014.

Visual cortex in aging and Alzheimer's disease: changes in visual field maps and population receptive fields

Affiliations

Visual cortex in aging and Alzheimer's disease: changes in visual field maps and population receptive fields

Alyssa A Brewer et al. Front Psychol. .

Abstract

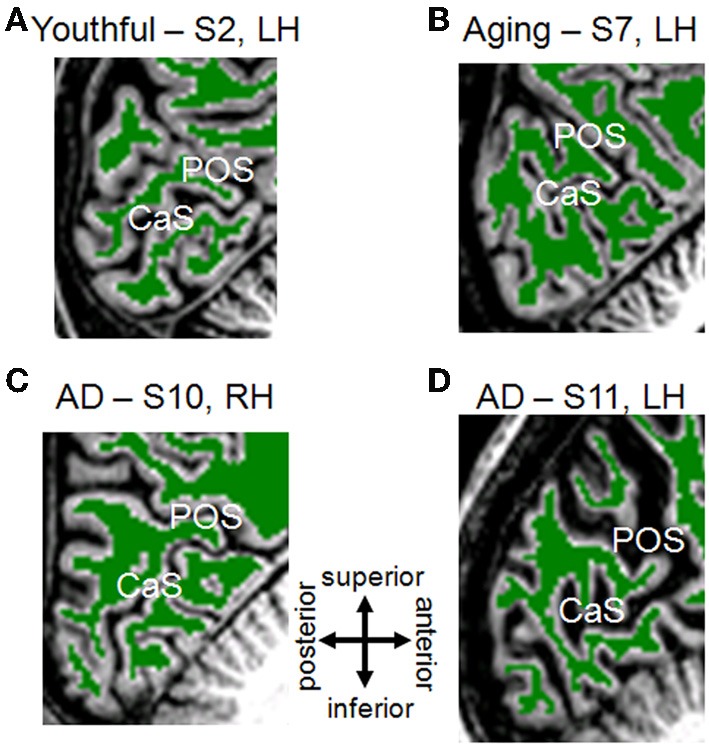
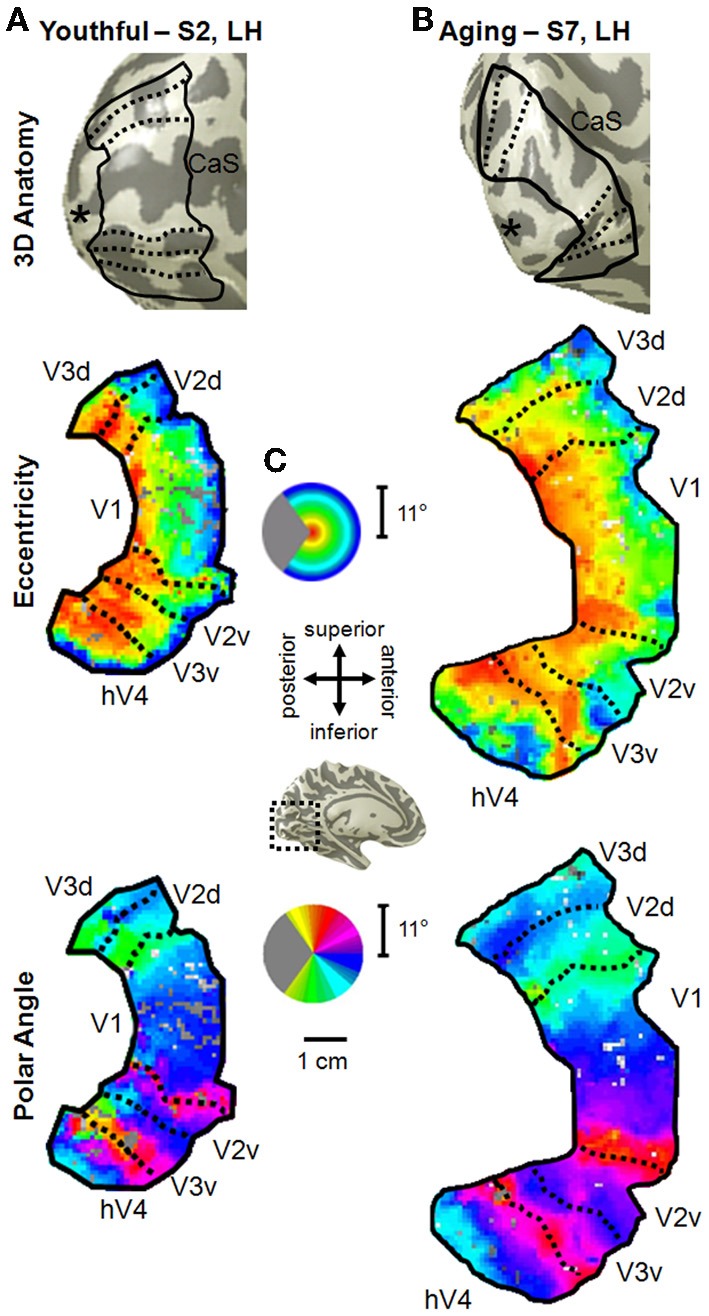
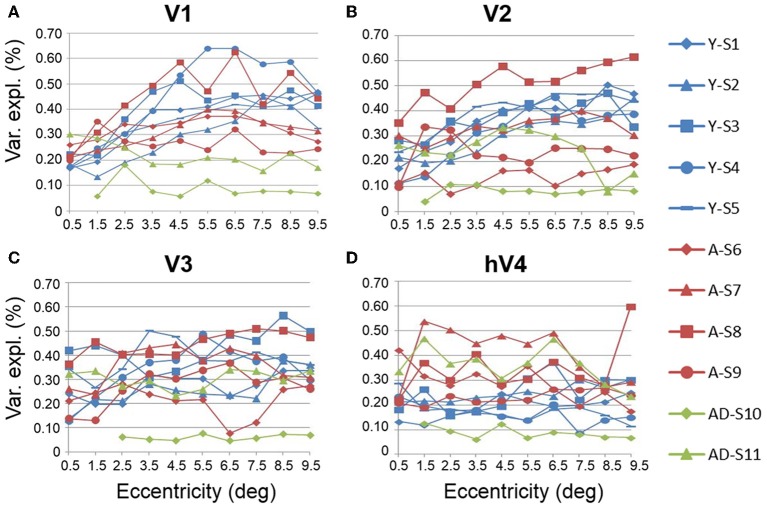
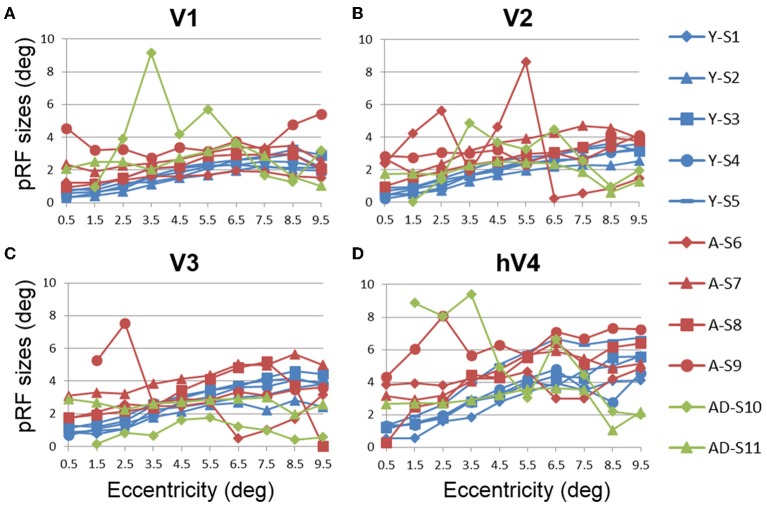
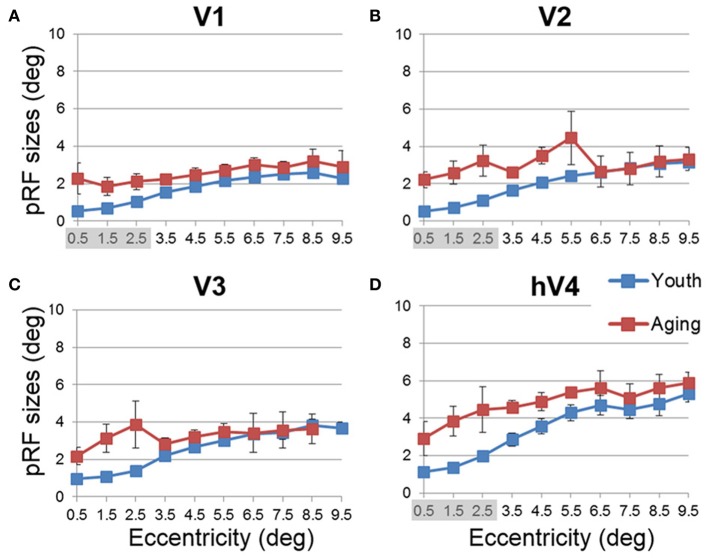
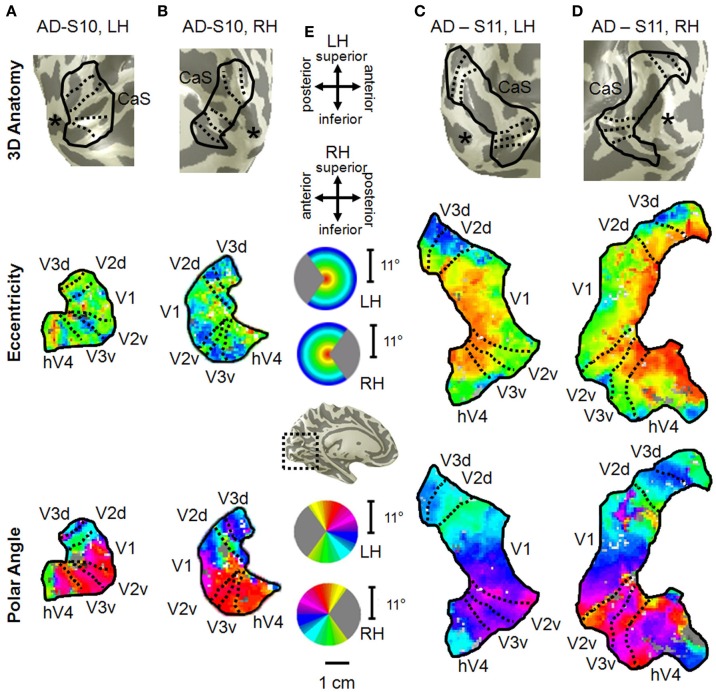
Although several studies have suggested that cortical alterations underlie such age-related visual deficits as decreased acuity, little is known about what changes actually occur in visual cortex during healthy aging. Two recent studies showed changes in primary visual cortex (V1) during normal aging; however, no studies have characterized the effects of aging on visual cortex beyond V1, important measurements both for understanding the aging process and for comparison to changes in age-related diseases. Similarly, there is almost no information about changes in visual cortex in Alzheimer's disease (AD), the most common form of dementia. Because visual deficits are often reported as one of the first symptoms of AD, measurements of such changes in the visual cortex of AD patients might improve our understanding of how the visual system is affected by neurodegeneration as well as aid early detection, accurate diagnosis and timely treatment of AD. Here we use fMRI to first compare the visual field map (VFM) organization and population receptive fields (pRFs) between young adults and healthy aging subjects for occipital VFMs V1, V2, V3, and hV4. Healthy aging subjects do not show major VFM organizational deficits, but do have reduced surface area and increased pRF sizes in the foveal representations of V1, V2, and hV4 relative to healthy young control subjects. These measurements are consistent with behavioral deficits seen in healthy aging. We then demonstrate the feasibility and first characterization of these measurements in two patients with mild AD, which reveal potential changes in visual cortex as part of the pathophysiology of AD. Our data aid in our understanding of the changes in the visual processing pathways in normal aging and provide the foundation for future research into earlier and more definitive detection of AD.

Keywords: Alzheimer's disease; aging; population receptive field modeling; vision; visual field mapping.


Figures

Figure 1
Figure 1
White/Gray matter segmentation for young, healthy aging, and mild Alzheimer's disease subjects. Each panel is a T1-weighted 3D MPRAGE image showing a sagittal slice near the midline of the brain, cropped to the occipital lobe with the calcarine sulcus (CaS; home to V1) and the parietal-occipital sulcus (POS) visible. Green-colored overlay represents white matter identified by an automated algorithm (Teo et al., 1997) and adjusted by hand-editing to minimize segmentation errors (Dougherty et al., 2003). Gray regions are gray matter, and white regions are white matter not segmented in the cerebellum. Gray matter is grown from the boundary of the white matter and bounded by the cerebral spinal fluid (CSF; black adjacent to gray matter). Portions of skull and dura mater are also visible. (A) Youthful Subject 2, left hemisphere. (B) Aging Subject 7, left hemisphere. (C) Mild Alzheimer's disease Subject 10, right hemisphere. (D) Mild Alzheimer's disease Subject 11, left hemisphere. Compare AD-S10's intact anatomy to the visibly altered visual field maps from this subject in Figure 2. Note also the reverse pattern for AD-S11, who has grossly intact map sizes, but more strikingly increased CSF-filled space.
Figure 2
Figure 2
Visual field map measurements in healthy young and aging subjects. (A) Example of VFMs V1, V2, V3, and hV4 from a healthy young adult (S2, left hemisphere). VFM boundaries are overlaid on a 3D representation of S2's left hemisphere (top panel). The “*” denotes the occipital pole. A cropped, close-up view of the flattened cortical surface surrounding the calcarine sulcus is shown for measurements of eccentricity and polar angle in the middle and bottom panels, respectively. The pseudo-color overlay on each flattened cortical rendering represents the position in visual space that produces the strongest response at each cortical location [see colored legend insets in (C)]. The stimuli covered the central 11° radius of visual space. For clarity, the visual responses are only shown for the VFMs of interest, V1, V2, V3, hV4. (B) Example of VFMs V1, V2, V3, and hV4 from a healthy aging subject (S7, left hemisphere). Note regular, organized, orthogonal VFMs as seen in (A). (C) Legends and scale bar for flattened cortical maps are shown. Approximate cortical location is depicted on an example left hemisphere 3D rendering (black dotted lines, central inset).
Figure 3
Figure 3
Total surface area measurements for visual field maps. (A) Total surface area for each map for individual young (blue), healthy aging (red), and mild Alzheimer's disease (green) subjects. (B) Total surface area for each map averaged from ~0.5 to 10° across youthful subjects (blue bars) and normal aging subjects (red bars). Error bars indicate s.e.m. “*” marks statistically significant differences (p < 0.05) between youthful and healthy aging subjects in hV4.
Figure 4
Figure 4
Surface area percent distribution measurements for visual field maps in individual young, healthy aging, and mild Alzheimer's disease subjects. (A) V1. (B) V2. (C) V3. (D) hV4. Blue lines represent data from healthy young subjects, red lines represent data from healthy aging subjects, and green lines represent data from mild AD subjects. Each line represents data measured in individual subjects and averaged across both of each subject's hemispheres. Surface area percent is plotted as a function of degrees of eccentricity from 1 to 10° eccentricity (bins centered on 1.5–9.5°). Note the consistency for both the youthful and healthy aging subjects. Note also the different distribution for AD-S10 relative to the other subjects.
Figure 5
Figure 5
Average surface area percent distribution measurements for visual field maps in young and healthy aging subjects. (A) V1. (B) V2. (C) V3. (D) hV4. Blue lines represent data from healthy young subjects, and red lines represent data from healthy aging subjects. Each bar represents data measured in individual subjects and then averaged by eccentricity band across hemispheres. Surface area percent is plotted as a function of degrees of eccentricity from 1 to 10° eccentricity (bins centered on 1.5–9.5°). Shaded gray regions indicate significant differences (p < 0.05) between regions (0.5–3°) in each map. Note the relatively increased fovea distribution in the youthful subjects. Error bars indicate s.e.m.
Figure 6
Figure 6
Measurements of variance explained for visual field maps in individual young, healthy aging, and mild Alzheimer's disease subjects. (A) V1. (B) V2. (C) V3. (D) hV4. Blue lines represent data from healthy young subjects, red lines represent data from healthy aging subjects, and green lines represent data from mild AD subjects. Each line represents data measured in individual subjects and averaged across both of each subject's hemispheres. Variance explained is plotted as a function of degrees of eccentricity from 0 to 10° eccentricity (bins centered on 0.5–9.5°g). Note the consistency for the youthful subjects and the somewhat greater variability for the healthy aging subjects. Note also the different distribution for AD-S10 relative to the other subjects.
Figure 7
Figure 7
Average measurements of percent variance explained for visual field maps in young and healthy aging subjects. (A) V1. (B) V2. (C) V3. (D) hV4. Blue lines represent data from healthy young subjects, and red lines represent data from healthy aging subjects. Each bar represents data measured in individual subjects and then averaged by eccentricity band across hemispheres. Variance explained percent is plotted as a function of degrees of eccentricity from 0 to 10° eccentricity (bins centered on 0.5–9.5°). Shaded gray regions indicate significant differences (p < 0.05) between regions (0–3°) in each map. Error bars indicate s.e.m.
Figure 8
Figure 8
Population receptive field size measurements for visual field maps in individual young, healthy aging, and mild Alzheimer's disease subjects. (A) V1. (B) V2. (C) V3. (D) hV4. Blue lines represent data from healthy young subjects, red lines represent data from healthy aging subjects, and green lines represent data from mild AD subjects. Each line represents data measured in individual subjects and averaged across both of each subject's hemispheres. pRF size is plotted as a function of degrees of eccentricity from 0 to 10° eccentricity (bins centered on 0.5–9.5°). Note the strong consistency for the youthful subjects, whereas healthy aging subjects are generally consistent, with one subject showing large deviations for each map. Also note the differences between the two AD subjects.
Figure 9
Figure 9
Average population receptive field size measurements for visual field maps in young and healthy aging subjects. (A) V1. (B) V2. (C) V3. (D) hV4. Blue lines represent data from healthy young subjects, and red lines represent data from healthy aging subjects. Each bar represents data measured in individual subjects and then averaged by eccentricity band across hemispheres. Average pRF size is plotted as a function of degrees of eccentricity from 0 to 10° eccentricity (bins centered on 0.5–9.5°). Shaded gray regions indicate significant differences (p < 0.05) between regions (0–3°) in each map. Error bars indicate s.e.m.
Figure 10
Figure 10
Visual field map measurements in mild Alzheimer's disease subjects. Occipital VFMs V1, V2, V3, and hV4 are shown for the left (A) and right (B) hemispheres of a single subject with mild AD (S10). While the polar angle gradients (bottom panel) still contained the expected representations of contralateral visual space with orderly reversals between VFMs, the eccentricity measurements (middle panel), drawn from the same fMRI scans, were more disorganized. Also note the visibly smaller size of these VFMs in this subject compared to those shown for young and healthy aging subjects in Figure 2. A second set of VFMs is also shown for the left (C) and right (D) hemispheres from a second subject (S11) with mild Alzheimer's disease. This AD subject displayed more normal VFM sizes and foveal eccentricity representations, but also has visible changes in the peripheral eccentricity representations. (E) Legends and scale bar. Other details are as described in Figure 2. The “*” denotes the occipital pole.

References

    1. Alichniewicz K. K., Brunner F., Klunemann H. H., Greenlee M. W. (2012). Structural and functional neural correlates of visuospatial information processing in normal aging and amnestic mild cognitive impairment. Neurobiol. Aging. 33, 2781–2797 10.1016/j.neurobiolaging.2012.02.010 - DOI - PubMed
    1. Amano K., Wandell B. A., Dumoulin S. O. (2009). Visual field maps, population receptive field sizes, and visual field coverage in the human MT+ complex. J. Neurophysiol. 102, 2704–2718 10.1152/jn.00102.2009 - DOI - PMC - PubMed
    1. Armstrong R. A., Lantos P. L., Cairns N. J. (2005). Overlap between neurodegenerative disorders. Neuropathology 25, 111–124 10.1111/j.1440-1789.2005.00605.x - DOI - PubMed
    1. Balazsi A. G., Rootman J., Drance S. M., Schulzer M., Douglas G. R. (1984). The effect of age on the nerve fiber population of the human optic nerve. Am. J. Ophthalmol. 97, 760–766 - PubMed
    1. Baseler H. A., Brewer A. A., Sharpe L. T., Morland A. B., Jagle H., Wandell B. A. (2002). Reorganization of human cortical maps caused by inherited photoreceptor abnormalities. Nat. Neurosci. 5, 364–370 10.1038/nn817 - DOI - PubMed