. 2014 Feb 7:4:15.
doi: 10.3389/fonc.2014.00015. eCollection 2014.

Neuroendocrine tumors show altered expression of chondroitin sulfate, glypican 1, glypican 5, and syndecan 2 depending on their differentiation grade

Affiliations

Neuroendocrine tumors show altered expression of chondroitin sulfate, glypican 1, glypican 5, and syndecan 2 depending on their differentiation grade

Olivia García-Suárez et al. Front Oncol. .

Abstract

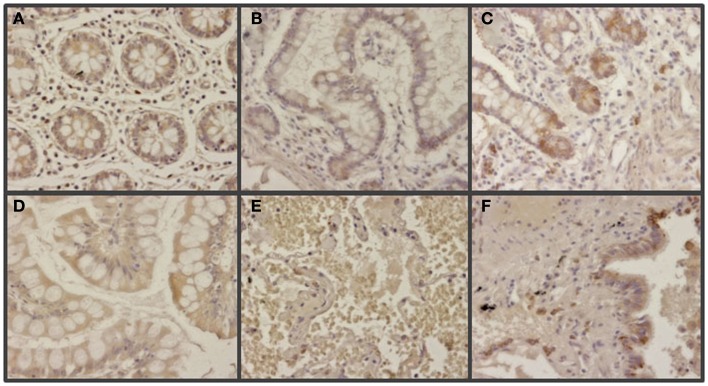
Neuroendocrine tumors (NETs) are found throughout the body and are important as they give rise to distinct clinical syndromes. Glycosaminoglycans, in proteoglycan (PG) form or as free chains, play vital roles in every step of tumor progression. Analyzing tumor samples with different degrees of histological differentiation we determined the existence of important alterations in chondroitin sulfate (CS) chains. Analysis of the transcription of the genes responsible for the production of CS showed a decline in the expression of some genes in poorly differentiated compared to well-differentiated tumors. Using anti-CS antibodies, normal stroma was always negative whereas tumoral stroma always showed a positive staining, more intense in the highest grade carcinomas, while tumor cells were negative. Moreover, certain specific cell surface PGs experienced a drastic decrease in expression depending on tumor differentiation. Syndecan 2 levels were very low or undetectable in healthy tissues, increasing significantly in well-differentiated tumors, and decreasing in poorly differentiated NETs, and its expression levels showed a positive correlation with patient survival. Glypican 5 appeared overexpressed in high-grade tumors with epithelial differentiation, and not in those that displayed a neuroendocrine phenotype. In contrast, normal neuroendocrine cells were positive for glypican 1, displaying intense staining in cytoplasm and membrane. Low-grade NETs had increased expression of this PG, but this reduced as tumor grade increased, its expression correlating positively with patient survival. Whilst elevated glypican 1 expression has been documented in different tumors, the downregulation in high-grade tumors observed in this work suggests that this proteoglycan could be involved in cancer development in a more complex and context-dependent manner than previously thought.

Keywords: chondroitin sulfate; glycosaminoglycan; glypican 1; glypican 5; neuroendocrine tumor; proteoglycan; syndecan 2.


Figures

Figure 1
Figure 1
Chondroitin sulfate and HS biosynthesis. Biosynthesis begins with the addition of a xylose to specific serine residues acceptor of a PG core protein. Subsequently, the biosynthesis continues with the stepwise addition of two galactose units, and a GlcA. HS chain extension requires the subsequent transference of a GlcNAc residue, while the addition of a GalNAc directs the pathway toward the biosynthesis of CS. Sites of action of the enzymes involved in the initiation of the synthesis of GAG chains and in the modification of the CS disaccharide unit are indicated.
Figure 2
Figure 2
Differential transcription of genes encoding HSPGs. (A) Relative transcript abundance of mRNAs for HSPGs. Relative abundance for well-differentiated lung NETs (gray bars) and poorly differentiated lung NETs (black bars) are plotted on a log scale for each gene assayed and the spread represents standard deviation. Genes showing significant differences are indicated: 1, p < 0.001; 2, p = 0.018; 3, p = 0.0001. (B) Relative expression ratio of genes that show statistically significant differences in expression in poorly differentiated compared to well-differentiated tumors. Values on the Y axis are represented on a logarithmic scale.
Figure 3
Figure 3
Immunohistochemical staining of syndecan 2 in NETs. (A,D,G,J) Normal tissue from colon (A), lung (D), small intestine (G), and gastric transitional mucosa (J). (B,E,H,K) Well-differentiated NETs from colon (B), lung (E), small intestine (H), and pancreas (K). (C,F,I,L) Poorly differentiated NETs from colon (C), lung (F), stomach (I), and pancreas (L). Syndecan 2 antibody marks normal epithelial cells, namely intracryptic cells, with faint cytoplasmic staining. The marking is enhanced in low degree NETs, decreasing in those NETs with the highest degree of malignancy (neuroendocrine carcinomas). Magnification 200×.
Figure 4
Figure 4
Quantification of immunochemical staining of syndecan 2. (A) Relative to the tumor differentiation. (B) Relative to tumor grade. (C) Relative to tumor stage. Semiquantitative scale from 0 to ++ was used. Vertical bars denote 0.95 confidence intervals.
Figure 5
Figure 5
Immunohistochemical staining of glypican 1 in NETs. (A,D,G,J) Normal tissue from colon (A), lung (D), small intestine (G), and gastric transitional mucosa (J). Arrows indicate neuroendocrine cells. (B,E,H,K) Well-differentiated NETs from colon (B), lung (E), small intestine (H), and pancreas (K). (C,F,I,L) Poorly differentiated NETs from colon (C), lung (F), stomach (I), and pancreas (L). Low-grade tumors exhibited markedly increased staining compared to normal tissue in both cytoplasm and cell membrane. By contrast, high-grade tumors showed a drastic decrease in expression. Magnification 200×.
Figure 6
Figure 6
Quantification of immunochemical staining of glypican 1. (A) Relative to tumor differentiation. (B) Relative to tumor grade. (C) Relative to tumor stage. Semiquantitative scale from 0 to +++ was used. Vertical bars denote 0.95 confidence intervals.
Figure 7
Figure 7
Immunohistochemical staining of glypican 5 in normal tissues. (A,B,D,E) Normal tissues not expressing GPC5 from colon (A), small intestine (B), gastric transitional mucosa (D), and lung (E). (C,F) Normal tissues displaying positive reaction in neuroendocrine cells from small intestine (C), and lung (F). Magnification 400×.
Figure 8
Figure 8
Immunohistochemical staining of glypican 5 in NETs. (A,B,D,G,J) Well-differentiated NETs; tumors not expressing GPC5 from colon (A), lung (D), small intestine (G) and pancreas (J), and displaying positive reaction from colon (B). (C,E,F,H,I,K,L) Poorly differentiated NETs; tumors showing positive reaction from colon (C), lung (F), stomach (I) and pancreas (L), and not expressing GPC5 from colon (E), lung (H) and stomach (K). Magnification 200×.
Figure 9
Figure 9
Quantification of immunochemical staining of glypican 5. (A) Relative to tumor differentiation. (B) Relative to tumor grade. (C) Relative to tumor stage. Semiquantitative scale from 0 to +++ was used. Vertical bars denote 0.95 confidence intervals.
Figure 10
Figure 10
Differential transcription of genes encoding enzymes involved in the biosynthesis of CS repeating unit. (A) Relative transcript abundance of mRNAs for CS biosynthesis. Relative abundance for well-differentiated lung NETs (gray bars) and poorly differentiated lung NETs (black bars) are plotted on a log scale for each gene assayed and spread represents standard deviation. Genes showing significant differences are indicated: 1, p = 0.04; 2, p = 0.03; 3, p = 0.003; 4, p = 0.01; 5, p = 0.02; 6, p = 0.03; 7, p = 0.01; 8, p = 0.01. (B) Relative expression ratio of genes that show statistically significant differences in expression in poorly differentiated compared to well-differentiated tumors. Values on the Y axis are represented on a logarithmic scale.
Figure 11
Figure 11
Immunohistochemical staining of CS in NETs. (A,D,G,J) Normal tissue from colon (A), lung (D), small intestine (G), and gastric transitional mucosa (J). (B,E,H,K) Well-differentiated NETs from colon (B), lung (E), small intestine (H), and pancreas (K). (C,F,I,L) Poorly differentiated NETs from colon (C), lung (F), stomach (I), and pancreas (L). Normal tissue samples displayed faint stromal staining, also present in isolated intestinal epithelial cells (A,D,G,J); well-differentiated NETs showed focal stromal staining (B,E,H,K), clearly enhanced in the cases of poorly differentiated tumors (C,F,I,L). Magnification 400×.
Figure 12
Figure 12
Quantification of immunochemical staining of CS. (A) Relative to tumor differentiation. (B) Relative to tumor grade. (C) Relative to tumor stage. Semiquantitative scale from 0 to +++ was used. Vertical bars denote 0.95 confidence intervals.

References

    1. Warner RR. Enteroendocrine tumors other than carcinoid: a review of clinically significant advances. Gastroenterology (2008) 128:1668–8410.1053/j.gastro.2005.03.078 - DOI - PubMed
    1. Taal BG, Visser O. Epidemiology of neuroendocrine tumours. Neuroendocrinology (2004) 80:3–710.1159/000080731 - DOI - PubMed
    1. Duerr EM, Chung DC. Molecular genetics of neuroendocrine tumors. Best Pract Res Clin Endocrinol Metab (2007) 21:1–1410.1016/j.beem.2006.12.001 - DOI - PubMed
    1. Klimstra DS, Modlin IR, Coppola D, Lloyd RV, Suster S. The pathologic classification of neuroendocrine tumors. Pancreas (2010) 39:707–1210.1097/MPA.0b013e3181ec124e - DOI - PubMed
    1. Shia J, Tang LH, Weiser MR, Brenner B, Adsay NV, Stelow EB, et al. Is nonsmall cell type high-grade neuroendocrine carcinoma of the tubular gastrointestinal tract a distinct disease entity? Am J Surg Pathol (2008) 32:719–3110.1097/PAS.0b013e318159371c - DOI - PubMed

LinkOut - more resources