

Ion dynamics in a trapped ion mobility spectrometer
- PMID: 24571000
- PMCID: PMC4144823
- DOI: 10.1039/c3an02174b
Ion dynamics in a trapped ion mobility spectrometer
Abstract
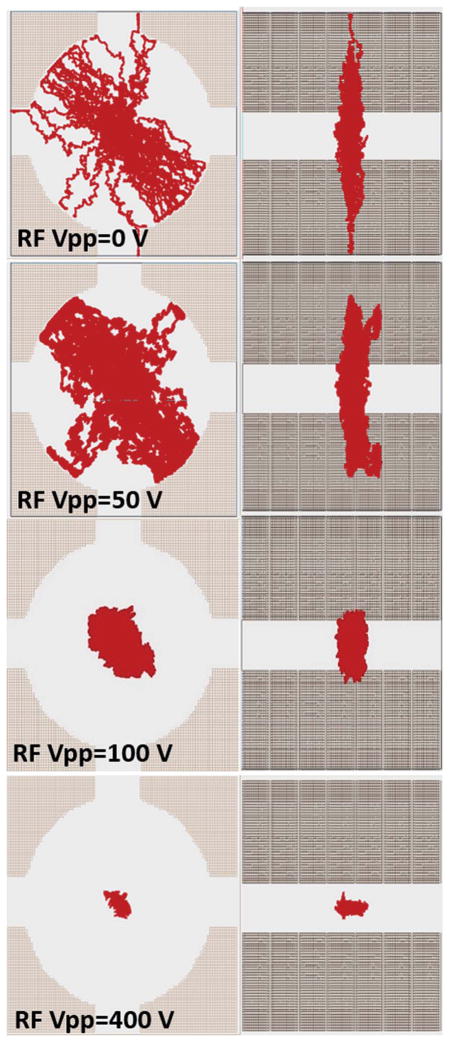
In the present paper, theoretical simulations and experimental observations are used to describe the ion dynamics in a trapped ion mobility spectrometer. In particular, the ion motion, ion transmission and mobility separation are discussed as a function of the bath gas velocity, radial confinement, analysis time and speed. Mobility analysis and calibration procedure are reported for the case of sphere-like molecules for positive and negative ion modes. Results showed that a maximal mobility resolution can be achieved by optimizing the gas velocity, radial confinement (RF amplitude) and ramp speed (voltage range and ramp time). The mobility resolution scales with the electric field and gas velocity and R = 100-250 can be routinely obtained at room temperature.
Figures


Similar articles
-
Note: Integration of trapped ion mobility spectrometry with mass spectrometry.Rev Sci Instrum. 2011 Dec;82(12):126106. doi: 10.1063/1.3665933. Rev Sci Instrum. 2011. PMID: 22225261 Free PMC article.
-
Gas-phase separation using a trapped ion mobility spectrometer.Int J Ion Mobil Spectrom. 2011 Sep;14(2-3):10.1007/s12127-011-0067-8. doi: 10.1007/s12127-011-0067-8. Int J Ion Mobil Spectrom. 2011. PMID: 24163587 Free PMC article.
-
Analysis of Ion Motion and Diffusion Confinement in Inverted Drift Tubes and Trapped Ion Mobility Spectrometry Devices.Anal Chem. 2019 Jan 2;91(1):919-927. doi: 10.1021/acs.analchem.8b03930. Epub 2018 Dec 18. Anal Chem. 2019. PMID: 30508367
-
[Applications of ion mobility-mass spectrometry in the chemical analysis in traditional Chinese medicines].Se Pu. 2022 Sep;40(9):782-787. doi: 10.3724/SP.J.1123.2022.01028. Se Pu. 2022. PMID: 36156624 Free PMC article. Review. Chinese.
-
Process analysis using ion mobility spectrometry.Anal Bioanal Chem. 2006 Mar;384(5):1059-70. doi: 10.1007/s00216-005-3397-8. Epub 2005 Aug 23. Anal Bioanal Chem. 2006. PMID: 16132133 Review.
Cited by
-
Fast and Effective Ion Mobility-Mass Spectrometry Separation of d-Amino-Acid-Containing Peptides.Anal Chem. 2017 Nov 7;89(21):11787-11794. doi: 10.1021/acs.analchem.7b03401. Epub 2017 Oct 19. Anal Chem. 2017. PMID: 28982001 Free PMC article.
-
Optimized Time-Segmented Acquisition Expands Peptide and Protein Identification in TIMS-TOF Pro Mass Spectrometry.J Proteome Res. 2025 Feb 7;24(2):526-536. doi: 10.1021/acs.jproteome.4c00690. Epub 2025 Jan 22. J Proteome Res. 2025. PMID: 39842810 Free PMC article.
-
Determination of ion mobility collision cross sections for unresolved isomeric mixtures using tandem mass spectrometry and chemometric deconvolution.Anal Chim Acta. 2016 Oct 5;939:64-72. doi: 10.1016/j.aca.2016.07.031. Epub 2016 Jul 28. Anal Chim Acta. 2016. PMID: 27639144 Free PMC article.
-
From Solution to Gas Phase: Revealing Ligand-Dependent Conformations of Ribonuclease A with Tandem-Trapped Ion Mobility Spectrometry.JACS Au. 2025 Jun 23;5(7):3219-3227. doi: 10.1021/jacsau.5c00405. eCollection 2025 Jul 28. JACS Au. 2025. PMID: 40747031 Free PMC article.
-
Structural Heterogeneity of Human Histone H2A.1.J Phys Chem B. 2021 May 20;125(19):4977-4986. doi: 10.1021/acs.jpcb.1c00335. Epub 2021 May 11. J Phys Chem B. 2021. PMID: 33974801 Free PMC article.
References
-
- Dwivedi P, Wu P, Klopsch S, Puzon G, Xun L, Hill H. Metabolic profiling by ion mobility mass spectrometry (IMMS) Metabolomics. 2008;4:63–80.
-
- Eiceman GA, Krylov EV, Krylova NS, Nazarov EG, Miller RA. Separation of Ions from Explosives in Differential Mobility Spectrometry by Vapor-Modified Drift Gas. Anal Chem. 2004;76:4937–4944. - PubMed
-
- Cheung W, Xu Y, Thomas CL, Goodacre R. Discrimination of bacteria using pyrolysis-gas chromatography-differential mobility spectrometry (Py-GC-DMS) and chemometrics. Analyst. 2009;134:557–563. - PubMed
MeSH terms
Substances
Grants and funding
LinkOut - more resources
Full Text Sources
Other Literature Sources