

Construction of a radiation hybrid panel and the first yellowtail (Seriola quinqueradiata) radiation hybrid map using a nanofluidic dynamic array
- PMID: 24571093
- PMCID: PMC3943507
- DOI: 10.1186/1471-2164-15-165
Construction of a radiation hybrid panel and the first yellowtail (Seriola quinqueradiata) radiation hybrid map using a nanofluidic dynamic array
Abstract
Background: Yellowtail (Seriola quinqueradiata) are an economically important species in Japan. However, there are currently no methods for captive breeding and early rearing for yellowtail. Thus, the commercial cultivation of this species is reliant upon the capture of wild immature fish. Given this, there is a need to develop captive breeding techniques to reduce pressure on wild stocks and facilitate the sustainable development of yellowtail aquaculture. We constructed a whole genome radiation hybrid (RH) panel for yellowtail gene mapping and developed a framework physical map using a nanofluidic dynamic array to use SNPs (single nucleotide polymorphisms) in ESTs (expressed sequence tags) for the DNA-assisted breeding of yellowtail.
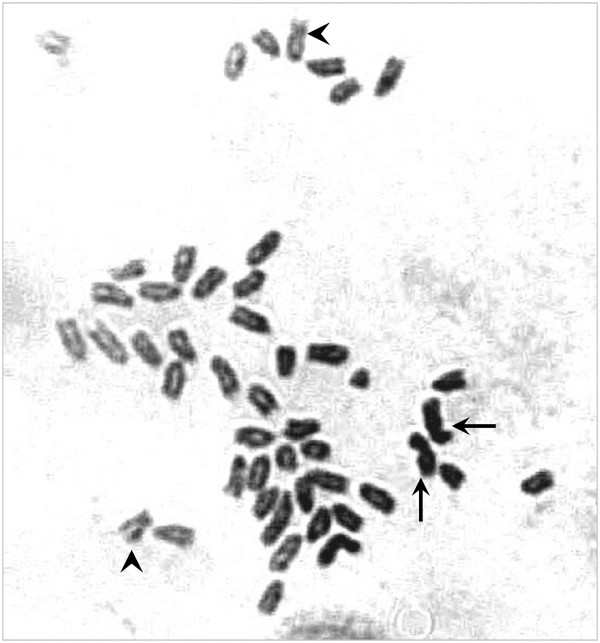
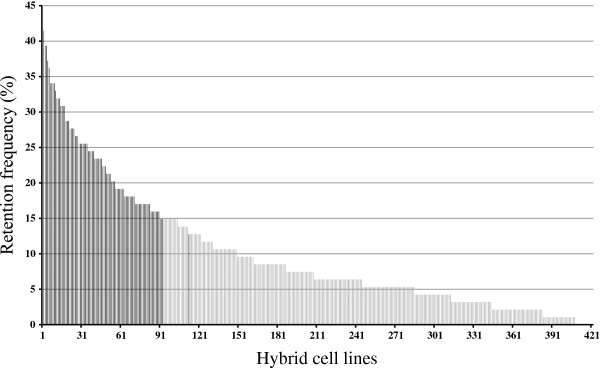
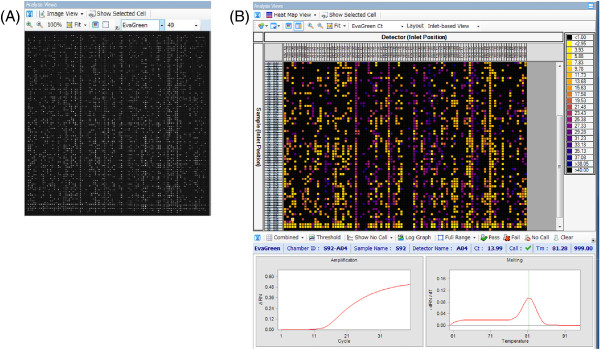
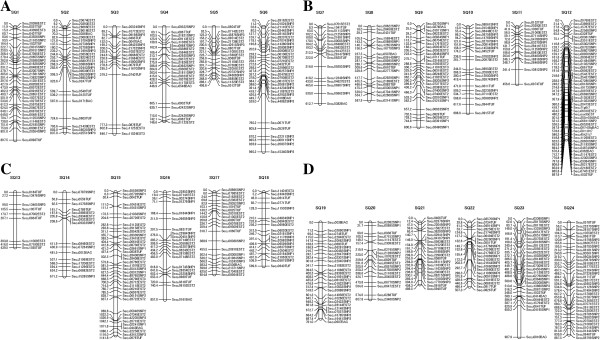
Results: Clonal RH cell lines were obtained after ionizing radiation; specifically, 78, 64, 129, 55, 42, and 53 clones were isolated after treatment with 3,000, 4,000, 5,000, 6,000, 8,000, or 10,000 rads, respectively. A total of 421 hybrid cell lines were obtained by fusion with mouse B78 cells. Ninety-four microsatellite markers used in the genetic linkage map were genotyped using the 421 hybrid cell lines. Based upon marker retention and genome coverage, we selected 93 hybrid cell lines to form an RH panel. Importantly, we performed the first genotyping of yellowtail markers in an RH panel using a nanofluidic dynamic array (Fluidigm, CA, USA). Then, 580 markers containing ESTs and SNPs were mapped in the first yellowtail RH map.
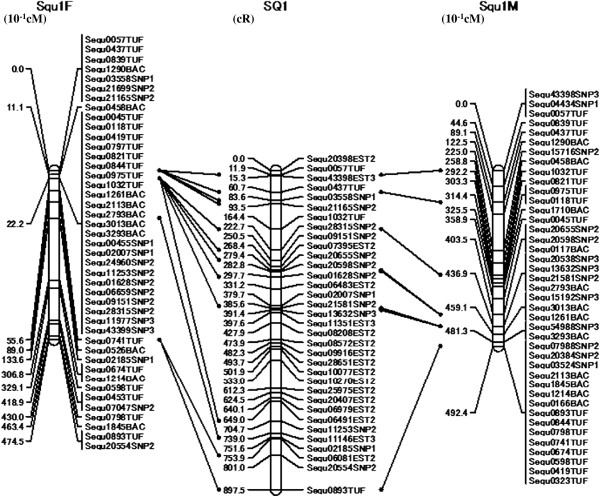
Conclusions: We successfully developed a yellowtail RH panel to facilitate the localization of markers. Using this, a framework RH map was constructed with 580 markers. This high-density physical map will serve as a useful tool for the identification of genes related to important breeding traits using genetic structural information, such as conserved synteny. Moreover, in a comparison of 30 sequences in the RH group 1 (SQ1), yellowtail appeared to be evolutionarily closer to medaka and the green-spotted pufferfish than to zebrafish. We suggest that synteny analysis may be potentially useful as a tool to investigate chromosomal evolution by comparison with model fish.
Figures
References
-
- MAFF. Ministry of Agriculture, Forestry and Fisheries, Japan. http://www.maff.go.jp/j/tokei/kouhyou/kaimen_gyosei/index.html (in Japanese)
-
- Ohara E, Nishimura T, Nagakura Y, Sakamoto T, Mushiake K, Okamoto N. Genetic linkage maps of two yellowtails (Seriola quinqueradiata and Seriola lalandi) Aquaculture. 2005;244:41–48. doi: 10.1016/j.aquaculture.2004.10.022. - DOI
Publication types
MeSH terms
LinkOut - more resources
Full Text Sources
Other Literature Sources
