

BMI1 reprogrammes histone acetylation and enhances c-fos pathway via directly binding to Zmym3 in malignant myeloid progression
- PMID: 24571310
- PMCID: PMC4508141
- DOI: 10.1111/jcmm.12246
BMI1 reprogrammes histone acetylation and enhances c-fos pathway via directly binding to Zmym3 in malignant myeloid progression
Abstract
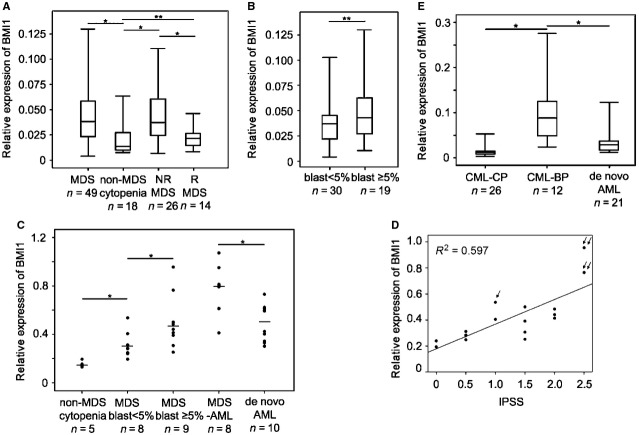
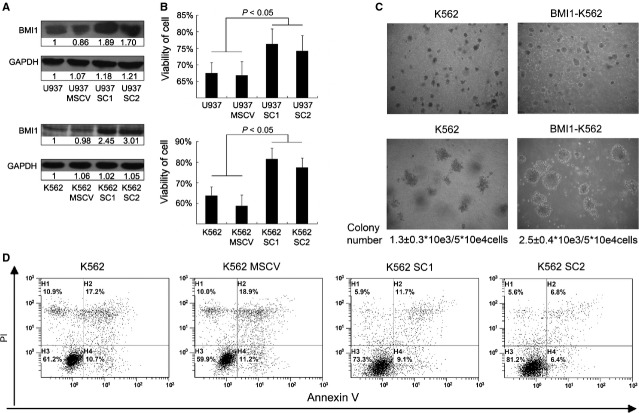
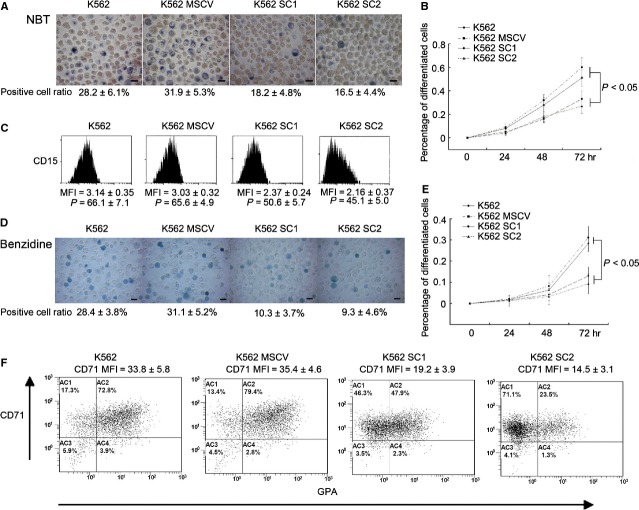
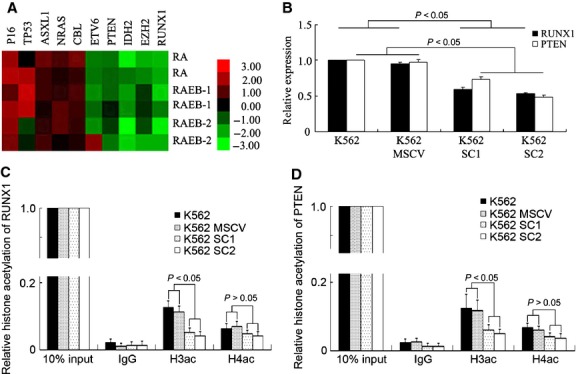
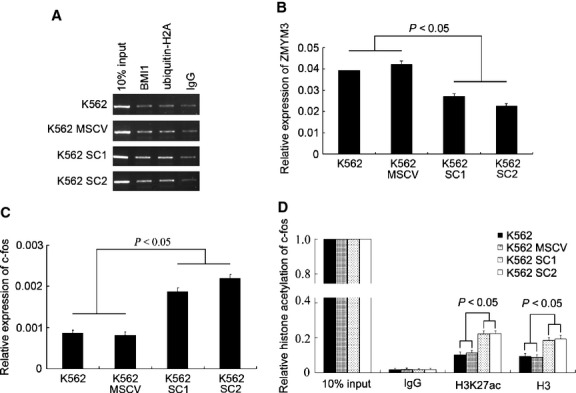
The polycomb group BMI1 is proved to be crucial in malignant myeloid progression. However, the underlying mechanism of the action of BMI1 in myeloid malignant progression was not well characterized. In this study, we found that the patients of both myelodysplastic syndromes and chronic myeloid leukaemia with BMI1 overexpression had a higher risk in malignant myeloid progression. In vitro gene transfection studies showed that BMI1 inhibited cell myeloid and erythroid differentiation induced by 12-O-tetradecanoyl phorbol-13-acetate (TPA) and histone deacetylase inhibitor sodium butyrate respectively. BMI1 also resisted apoptosis induced by arsenic trioxide. Moreover, the transcript levels of Runx1 and Pten were down-regulated in Bmi1-transfected cells in company with histone deacetylation modification. By using chromatin immunoprecipitation (ChIP) collaborated with secondary generation sequencing and verified by ChIP-PCR, we found that BMI1 directly bound to the promoter region of Zmym3, which encodes a component of histone deacetylase-containing complexes. In addition, as one of the downstream target genes of this complex, c-fos was activated with increasing histone acetylation when ZMYM3 was suppressed in the Bmi1-transfected cells. These results suggested that BMI1 may reprogramme the histone acetylation profile in multiple genes through either indirect or direct binding effects which probably contributes to the malignant progression of myeloid progenitor cells.
Keywords: BMI1; ZMYM3; acetylation; chronic myeloid leukaemia; myelodysplastic syndrome.
© 2014 The Authors. Journal of Cellular and Molecular Medicine published by John Wiley & Sons Ltd and Foundation for Cellular and Molecular Medicine.
Figures
Similar articles
-
Bmi1 reprograms CML B-lymphoid progenitors to become B-ALL-initiating cells.Blood. 2012 Jan 12;119(2):494-502. doi: 10.1182/blood-2011-06-359232. Epub 2011 Nov 18. Blood. 2012. PMID: 22101899 Free PMC article.
-
RUNX1/AML1 mutant collaborates with BMI1 overexpression in the development of human and murine myelodysplastic syndromes.Blood. 2013 Apr 25;121(17):3434-46. doi: 10.1182/blood-2012-06-434423. Epub 2013 Mar 7. Blood. 2013. PMID: 23471304
-
The BMI1 polycomb protein represses cyclin G2-induced autophagy to support proliferation in chronic myeloid leukemia cells.Leukemia. 2015 Oct;29(10):1993-2002. doi: 10.1038/leu.2015.112. Epub 2015 Apr 30. Leukemia. 2015. PMID: 25925206
-
Overexpression of BMI1 confers clonal cells resistance to apoptosis and contributes to adverse prognosis in myelodysplastic syndrome.Cancer Lett. 2012 Apr 1;317(1):33-40. doi: 10.1016/j.canlet.2011.11.012. Epub 2011 Nov 23. Cancer Lett. 2012. PMID: 22120066
-
BMI1 and PTEN are key determinants of breast cancer therapy: A plausible therapeutic target in breast cancer.Gene. 2018 Dec 15;678:302-311. doi: 10.1016/j.gene.2018.08.022. Epub 2018 Aug 8. Gene. 2018. PMID: 30096458 Review.
Cited by
-
The Hemogenic Competence of Endothelial Progenitors Is Restricted by Runx1 Silencing during Embryonic Development.Cell Rep. 2016 Jun 7;15(10):2185-2199. doi: 10.1016/j.celrep.2016.05.001. Epub 2016 May 26. Cell Rep. 2016. PMID: 27239041 Free PMC article.
-
FOXM1: an emerging master regulator of DNA damage response and genotoxic agent resistance.Biochim Biophys Acta. 2014 Nov;1839(11):1316-22. doi: 10.1016/j.bbagrm.2014.09.016. Epub 2014 Oct 5. Biochim Biophys Acta. 2014. PMID: 25287128 Free PMC article. Review.
-
Silencing BMI1 eliminates tumor formation of pediatric glioma CD133+ cells not by affecting known targets but by down-regulating a novel set of core genes.Acta Neuropathol Commun. 2014 Dec 20;2:160. doi: 10.1186/s40478-014-0160-4. Acta Neuropathol Commun. 2014. PMID: 25526772 Free PMC article.
-
Preclinical activity of the novel B-cell-specific Moloney murine leukemia virus integration site 1 inhibitor PTC-209 in acute myeloid leukemia: Implications for leukemia therapy.Cancer Sci. 2015 Dec;106(12):1705-13. doi: 10.1111/cas.12833. Epub 2015 Nov 20. Cancer Sci. 2015. PMID: 26450753 Free PMC article.
-
Epigenetic roots of immunologic disease and new methods for examining chromatin regulatory pathways.Immunol Cell Biol. 2015 Mar;93(3):261-70. doi: 10.1038/icb.2014.105. Epub 2014 Dec 23. Immunol Cell Biol. 2015. PMID: 25533290 Review.
References
-
- Tefferi A, Vardiman JW. Myelodysplastic syndromes. N Engl J Med. 2009;361:1872–85. - PubMed
-
- Costa D, Muñoz C, Carrió A, et al. Reciprocal translocations in myelodysplastic syndromes and chronic myelomonocytic leukemias: review of 5654 patients with an evaluable karyotype. Genes Chromosom Cancer. 2013;52:753–63. - PubMed
Publication types
MeSH terms
Substances
LinkOut - more resources
Full Text Sources
Other Literature Sources
Medical
Research Materials
