Glycoprotein biomarker panel for pancreatic cancer discovered by quantitative proteomics analysis
- PMID: 24571389
- PMCID: PMC3993962
- DOI: 10.1021/pr400967x
Glycoprotein biomarker panel for pancreatic cancer discovered by quantitative proteomics analysis
Abstract
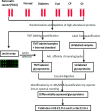
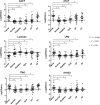
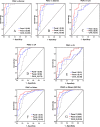
Pancreatic cancer is a lethal disease where specific early detection biomarkers would be very valuable to improve outcomes in patients. Many previous studies have compared biosamples from pancreatic cancer patients with healthy controls to find potential biomarkers. However, a range of related disease conditions can influence the performance of these putative biomarkers, including pancreatitis and diabetes. In this study, quantitative proteomics methods were applied to discover potential serum glycoprotein biomarkers that distinguish pancreatic cancer from other pancreas related conditions (diabetes, cyst, chronic pancreatitis, obstructive jaundice) and healthy controls. Aleuria aurantia lectin (AAL) was used to extract fucosylated glycoproteins and then both TMT protein-level labeling and label-free quantitative analysis were performed to analyze glycoprotein differences from 179 serum samples across the six different conditions. A total of 243 and 354 serum proteins were identified and quantified by label-free and TMT protein-level quantitative strategies, respectively. Nineteen and 25 proteins were found to show significant differences in samples between the pancreatic cancer and other conditions using the label-free and TMT strategies, respectively, with 7 proteins considered significant in both methods. Significantly different glycoproteins were further validated by lectin-ELISA and ELISA assays. Four candidates were identified as potential markers with profiles found to be highly complementary with CA 19-9 (p < 0.001). Obstructive jaundice (OJ) was found to have a significant impact on the performance of every marker protein, including CA 19-9. The combination of α-1-antichymotrypsin (AACT), thrombospondin-1 (THBS1), and haptoglobin (HPT) outperformed CA 19-9 in distinguishing pancreatic cancer from normal controls (AUC = 0.95), diabetes (AUC = 0.89), cyst (AUC = 0.82), and chronic pancreatitis (AUC = 0.90). A marker panel of AACT, THBS1, HPT, and CA 19-9 showed a high diagnostic potential in distinguishing pancreatic cancer from other conditions with OJ (AUC = 0.92) or without OJ (AUC = 0.95).
Figures


Similar articles
-
Quantitative analysis of single amino acid variant peptides associated with pancreatic cancer in serum by an isobaric labeling quantitative method.J Proteome Res. 2014 Dec 5;13(12):6058-66. doi: 10.1021/pr500934u. Epub 2014 Nov 24. J Proteome Res. 2014. PMID: 25393578 Free PMC article.
-
Validation of four candidate pancreatic cancer serological biomarkers that improve the performance of CA19.9.BMC Cancer. 2013 Sep 3;13:404. doi: 10.1186/1471-2407-13-404. BMC Cancer. 2013. PMID: 24007603 Free PMC article.
-
Protein alterations associated with pancreatic cancer and chronic pancreatitis found in human plasma using global quantitative proteomics profiling.J Proteome Res. 2011 May 6;10(5):2359-76. doi: 10.1021/pr101148r. Epub 2011 Mar 28. J Proteome Res. 2011. PMID: 21443201 Free PMC article.
-
Clinical Perspective on Proteomic and Glycomic Biomarkers for Diagnosis, Prognosis, and Prediction of Pancreatic Cancer.Int J Mol Sci. 2021 Mar 6;22(5):2655. doi: 10.3390/ijms22052655. Int J Mol Sci. 2021. PMID: 33800786 Free PMC article.
-
Proteomic profiling of pancreatic cancer for biomarker discovery.Mol Cell Proteomics. 2005 Apr;4(4):523-33. doi: 10.1074/mcp.R500004-MCP200. Epub 2005 Jan 31. Mol Cell Proteomics. 2005. PMID: 15684406 Review.
Cited by
-
A procedure for the analysis of site-specific and structure-specific fucosylation in alpha-1-antitrypsin.Electrophoresis. 2016 Oct;37(20):2624-2632. doi: 10.1002/elps.201600176. Epub 2016 Sep 5. Electrophoresis. 2016. PMID: 27439567 Free PMC article.
-
Transcriptome analysis of sinensetin-treated liver cancer cells guided by biological network analysis.Oncol Lett. 2021 May;21(5):355. doi: 10.3892/ol.2021.12616. Epub 2021 Mar 4. Oncol Lett. 2021. PMID: 33747212 Free PMC article.
-
Multibiomarker panels in liquid biopsy for early detection of pancreatic cancer - a comprehensive review.J Exp Clin Cancer Res. 2024 Sep 2;43(1):250. doi: 10.1186/s13046-024-03166-w. J Exp Clin Cancer Res. 2024. PMID: 39218911 Free PMC article. Review.
-
Methods for quantification of glycopeptides by liquid separation and mass spectrometry.Mass Spectrom Rev. 2023 Mar;42(2):887-917. doi: 10.1002/mas.21771. Epub 2022 Feb 4. Mass Spectrom Rev. 2023. PMID: 35099083 Free PMC article. Review.
-
Advances in High Throughput Proteomics Profiling in Establishing Potential Biomarkers for Gastrointestinal Cancer.Cells. 2022 Mar 11;11(6):973. doi: 10.3390/cells11060973. Cells. 2022. PMID: 35326424 Free PMC article. Review.
References
-
- Jemal A.; Siegel R.; Ward E.; Hao Y.; Xu J.; Thun M. J. Cancer statistics, 2009. Ca–Cancer J. Clin. 2009, 594225–49. - PubMed
-
- Chu D.; Kohlmann W.; Adler D. G. Identification and screening of individuals at increased risk for pancreatic cancer with emphasis on known environmental and genetic factors and hereditary syndromes. JOP 2010, 113203–12. - PubMed
-
- Sohn T. A.; Lillemoe K. D.; Cameron J. L.; Huang J. J.; Pitt H. A.; Yeo C. J. Surgical palliation of unresectable periampullary adenocarcinoma in the 1990s. J. Am. Coll. Surg. 1999, 1886658–66discussion 666–9.. - PubMed
-
- Singh P.; Srinivasan R.; Wig J. D. Major molecular markers in pancreatic ductal adenocarcinoma and their roles in screening, diagnosis, prognosis, and treatment. Pancreas 2011, 405644–52. - PubMed
Publication types
MeSH terms
Substances
Grants and funding
LinkOut - more resources
Full Text Sources
Other Literature Sources
Medical
Miscellaneous

