

Inhibition of mTORC1 induces loss of E-cadherin through AKT/GSK-3β signaling-mediated upregulation of E-cadherin repressor complexes in non-small cell lung cancer cells
- PMID: 24571487
- PMCID: PMC3941688
- DOI: 10.1186/1465-9921-15-26
Inhibition of mTORC1 induces loss of E-cadherin through AKT/GSK-3β signaling-mediated upregulation of E-cadherin repressor complexes in non-small cell lung cancer cells
Abstract
Background: mTOR, which can form mTOR Complex 1 (mTORC1) or mTOR Complex 2 (mTORC2) depending on its binding partners, is frequently deregulated in the pulmonary neoplastic conditions and interstitial lung diseases of the patients treated with rapalogs. In this study, we investigated the relationship between mTOR signaling and epithelial mesenchymal transition (EMT) by dissecting mTOR pathways.
Methods: Components of mTOR signaling pathway were silenced by shRNA in a panel of non-small cell lung cancer cell lines and protein expression of epithelial and mesenchymal markers were evaluated by immunoblotting and immunocytochemistry. mRNA level of the E-cadherin repressor complexes were evaluated by qRT-PCR.
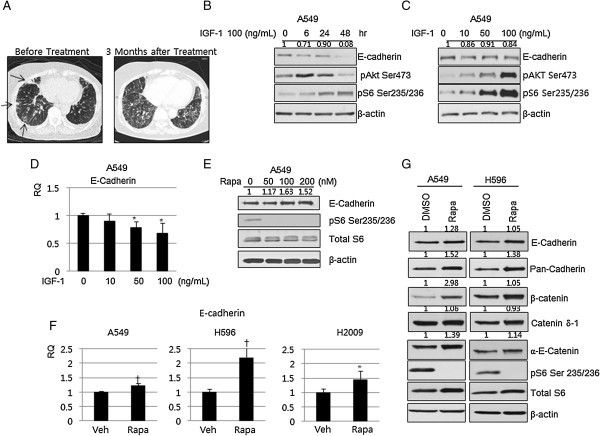
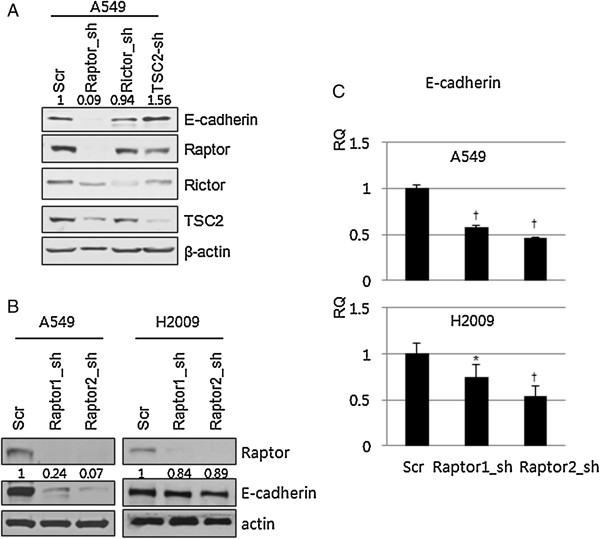
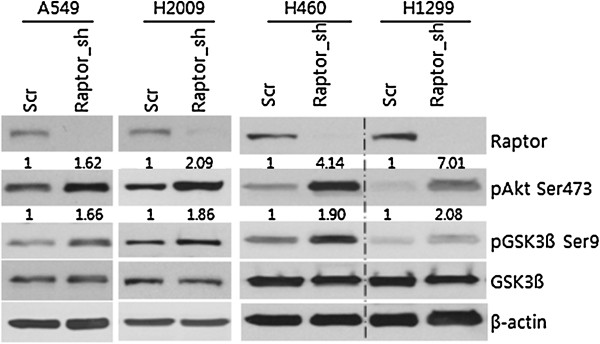
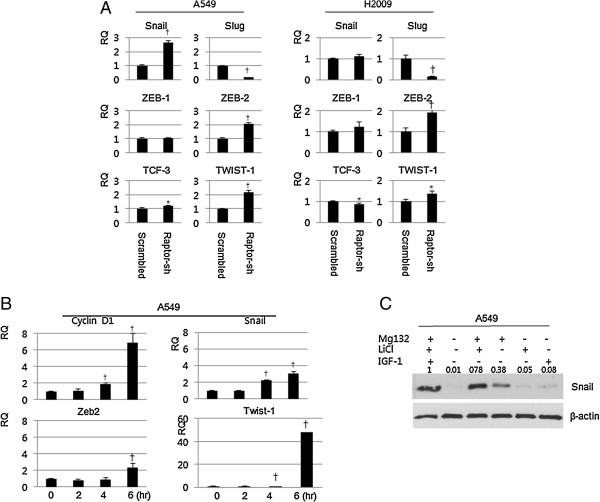
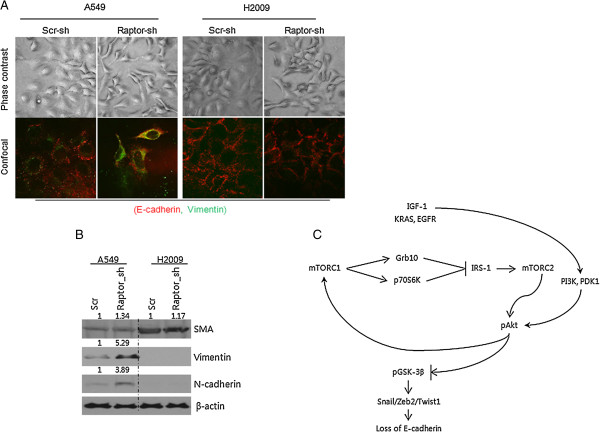
Results: IGF-1 treatment decreased expression of the E-cadherin and rapamycin increased its expression, suggesting hyperactivation of mTOR signaling relates to the loss of E-cadherin. Genetic ablation of rapamycin-insensitive companion of mTOR (Rictor), a component of mTORC2, did not influence E-cadherin expression, whereas genetic ablation of regulatory-associated protein of mTOR (Raptor), a component of mTORC1, led to a decrease in E-cadherin expression at the mRNA level. Increased phosphorylation of AKT at Ser473 and GSK-3β at Ser9 were observed in the Raptor-silenced NSCLC cells. Of the E-cadherin repressor complexes tested, Snail, Zeb2, and Twist1 mRNAs were elevated in raptor-silenced A549 cells, and Zeb2 and Twist1 mRNAs were elevated in Raptor-silenced H2009 cells. These findings were recapitulated by treatment with the GSK-3β inhibitor, LiCl. Raptor knockdown A549 cells showed increased expression of N-cadherin and vimentin with mesenchymal phenotypic changes.
Conclusions: In conclusion, selective inhibition of mTORC1 leads to hyperactivation of the AKT/GSK-3β pathway, inducing E-cadherin repressor complexes and EMT. These findings imply the existence of a feedback inhibition loop of mTORC1 onto mTORC2 that plays a role in the homeostasis of E-cadherin expression and EMT, requiring caution in the clinical use of rapalog and selective mTORC1 inhibitors.
Figures
Similar articles
-
Synergistic Effects between mTOR Complex 1/2 and Glycolysis Inhibitors in Non-Small-Cell Lung Carcinoma Cells.PLoS One. 2015 Jul 15;10(7):e0132880. doi: 10.1371/journal.pone.0132880. eCollection 2015. PLoS One. 2015. PMID: 26176608 Free PMC article.
-
mTORC1 and mTORC2 regulate insulin secretion through Akt in INS-1 cells.J Endocrinol. 2013 Jan 2;216(1):21-9. doi: 10.1530/JOE-12-0351. Print 2013 Jan. J Endocrinol. 2013. PMID: 23092880
-
PRR5, a novel component of mTOR complex 2, regulates platelet-derived growth factor receptor beta expression and signaling.J Biol Chem. 2007 Aug 31;282(35):25604-12. doi: 10.1074/jbc.M704343200. Epub 2007 Jun 28. J Biol Chem. 2007. PMID: 17599906
-
Discrete signaling mechanisms of mTORC1 and mTORC2: Connected yet apart in cellular and molecular aspects.Adv Biol Regul. 2017 May;64:39-48. doi: 10.1016/j.jbior.2016.12.001. Epub 2017 Jan 4. Adv Biol Regul. 2017. PMID: 28189457 Review.
-
Diverse signaling mechanisms of mTOR complexes: mTORC1 and mTORC2 in forming a formidable relationship.Adv Biol Regul. 2019 May;72:51-62. doi: 10.1016/j.jbior.2019.03.003. Epub 2019 Apr 11. Adv Biol Regul. 2019. PMID: 31010692 Review.
Cited by
-
The role of glycogen synthase kinase 3 beta in brain injury induced by myocardial ischemia/reperfusion injury in a rat model of diabetes mellitus.Neural Regen Res. 2017 Oct;12(10):1632-1639. doi: 10.4103/1673-5374.217337. Neural Regen Res. 2017. PMID: 29171428 Free PMC article.
-
mTOR Signaling in Pulmonary Vascular Disease: Pathogenic Role and Therapeutic Target.Int J Mol Sci. 2021 Feb 21;22(4):2144. doi: 10.3390/ijms22042144. Int J Mol Sci. 2021. PMID: 33670032 Free PMC article. Review.
-
Signaling pathway cooperation in TGF-β-induced epithelial-mesenchymal transition.Curr Opin Cell Biol. 2014 Dec;31:56-66. doi: 10.1016/j.ceb.2014.09.001. Epub 2014 Sep 18. Curr Opin Cell Biol. 2014. PMID: 25240174 Free PMC article. Review.
-
Perfluorooctanoic acid induces human Ishikawa endometrial cancer cell migration and invasion through activation of ERK/mTOR signaling.Oncotarget. 2016 Oct 11;7(41):66558-66568. doi: 10.18632/oncotarget.11684. Oncotarget. 2016. PMID: 27589685 Free PMC article.
-
Real-time analysis of epithelial-mesenchymal transition using fluorescent single-domain antibodies.Sci Rep. 2015 Aug 21;5:13402. doi: 10.1038/srep13402. Sci Rep. 2015. PMID: 26292717 Free PMC article.
References
-
- Hay N, Sonenberg N. Upstream and downstream of mTOR. Genes Dev. 1926–1945;2004:18. - PubMed
Publication types
MeSH terms
Substances
LinkOut - more resources
Full Text Sources
Other Literature Sources
Medical
Molecular Biology Databases
Research Materials
Miscellaneous
