

Placement, support, and retention of health professionals: national, cross-sectional findings from medical and dental community service officers in South Africa
- PMID: 24571826
- PMCID: PMC3975958
- DOI: 10.1186/1478-4491-12-14
Placement, support, and retention of health professionals: national, cross-sectional findings from medical and dental community service officers in South Africa
Abstract
Background: In South Africa, community service following medical training serves as a mechanism for equitable distribution of health professionals and their professional development. Community service officers are required to contribute a year towards serving in a public health facility while receiving supervision and remuneration. Although the South African community service programme has been in effect since 1998, little is known about how placement and practical support occur, or how community service may impact future retention of health professionals.
Methods: National, cross-sectional data were collected from community service officers who served during 2009 using a structured self-report questionnaire. A Supervision Satisfaction Scale (SSS) was created by summing scores of five questions rated on a three-point Likert scale (orientation, clinical advising, ongoing mentorship, accessibility of clinic leadership, and handling of community service officers' concerns). Research endpoints were guided by community service programmatic goals and analysed as dichotomous outcomes. Bivariate and multivariate logistical regressions were conducted using Stata 12.
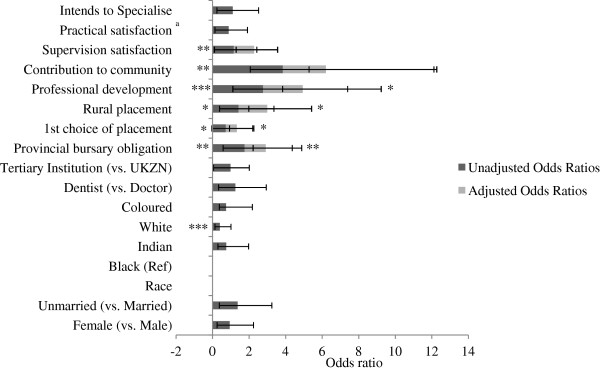
Results: The sample population comprised 685 doctors and dentists (response rate 44%). Rural placement was more likely among unmarried, male, and black practitioners. Rates of self-reported professional development were high (470 out of 539 responses; 87%). Participants with higher scores on the SSS were more likely to report professional development. Although few participants planned to continue work in rural, underserved communities (n = 171 out of 657 responses, 25%), those serving in a rural facility during the community service year had higher intentions of continuing rural work. Those reporting professional development during the community service year were twice as likely to report intentions to remain in rural, underserved communities.
Conclusions: Despite challenges in equitable distribution of practitioners, participant satisfaction with the compulsory community service programme appears to be high among those who responded to a 2009 questionnaire. These data offer a starting point for designing programmes and policies that better meet the health needs of the South African population through more appropriate human resource management. An emphasis on professional development and supervision is crucial if South Africa is to build practitioner skills, equitably distribute health professionals, and retain the medical workforce in rural, underserved areas.
Figures
Similar articles
-
Building a sustainable rural physician workforce.Med J Aust. 2021 Jul;215 Suppl 1:S5-S33. doi: 10.5694/mja2.51122. Med J Aust. 2021. PMID: 34218436
-
Compulsory community service for doctors in South Africa: A 15-year review.S Afr Med J. 2018 Aug 30;108(9):741-747. doi: 10.7196/SAMJ.2018.v108i9.13070. S Afr Med J. 2018. PMID: 30182899
-
Beyond the black stump: rapid reviews of health research issues affecting regional, rural and remote Australia.Med J Aust. 2020 Dec;213 Suppl 11:S3-S32.e1. doi: 10.5694/mja2.50881. Med J Aust. 2020. PMID: 33314144
-
Reviewing reliance on overseas-trained doctors in rural Australia and planning for self-sufficiency: applying 10 years' MABEL evidence.Hum Resour Health. 2019 Jan 22;17(1):8. doi: 10.1186/s12960-018-0339-z. Hum Resour Health. 2019. PMID: 30670027 Free PMC article. Review.
-
Rural placement experiences in dental education and the impact on professional intentions and employment outcomes-A systematic review.Eur J Dent Educ. 2018 Aug;22(3):e364-e378. doi: 10.1111/eje.12305. Epub 2017 Nov 23. Eur J Dent Educ. 2018. PMID: 29168610
Cited by
-
Factors Associated With Working in Remote Indonesia: A National Cross-Sectional Study of Early-Career Doctors.Front Med (Lausanne). 2021 May 13;8:594695. doi: 10.3389/fmed.2021.594695. eCollection 2021. Front Med (Lausanne). 2021. PMID: 34055819 Free PMC article.
-
Application of machine learning models in predicting length of stay among healthcare workers in underserved communities in South Africa.Hum Resour Health. 2018 Dec 13;16(1):68. doi: 10.1186/s12960-018-0329-1. Hum Resour Health. 2018. PMID: 30545374 Free PMC article.
-
Perceptions of newly-qualified nurses performing compulsory community service in KwaZulu-Natal.Curationis. 2015 Jul 8;38(1):1474. doi: 10.4102/curationis.v38i1.1474. Curationis. 2015. PMID: 26244458 Free PMC article.
-
The emerging radiographer's transient community service professional career pathway.Health SA. 2019 Oct 17;24:1280. doi: 10.4102/hsag.v24i0.1280. eCollection 2019. Health SA. 2019. PMID: 31934439 Free PMC article.
-
Gender income differences among general practitioners with compulsory services in early career stage in underdeveloped areas: evidence from a prospective cohort study in China.Hum Resour Health. 2024 Jun 27;22(1):45. doi: 10.1186/s12960-024-00930-z. Hum Resour Health. 2024. PMID: 38937757 Free PMC article.
References
-
- World Health Organization. World Health Report 2006: Working Together for Health. Geneva: World Health Organization; 2008.
-
- Habte D, Dussault G, Dovlo D. Challenges confronting the health workforce in sub-Saharan Africa. World Hosp Heal Serv. 2004;40:23–26. 0–1. - PubMed
Publication types
MeSH terms
Grants and funding
LinkOut - more resources
Full Text Sources
Other Literature Sources
Medical
