

Evaluation of apparent diffusion coefficient thresholds for diagnosis of medulloblastoma using diffusion-weighted imaging
- PMID: 24571835
- PMCID: PMC4202848
- DOI: 10.15274/NRJ-2014-10007
Evaluation of apparent diffusion coefficient thresholds for diagnosis of medulloblastoma using diffusion-weighted imaging
Abstract
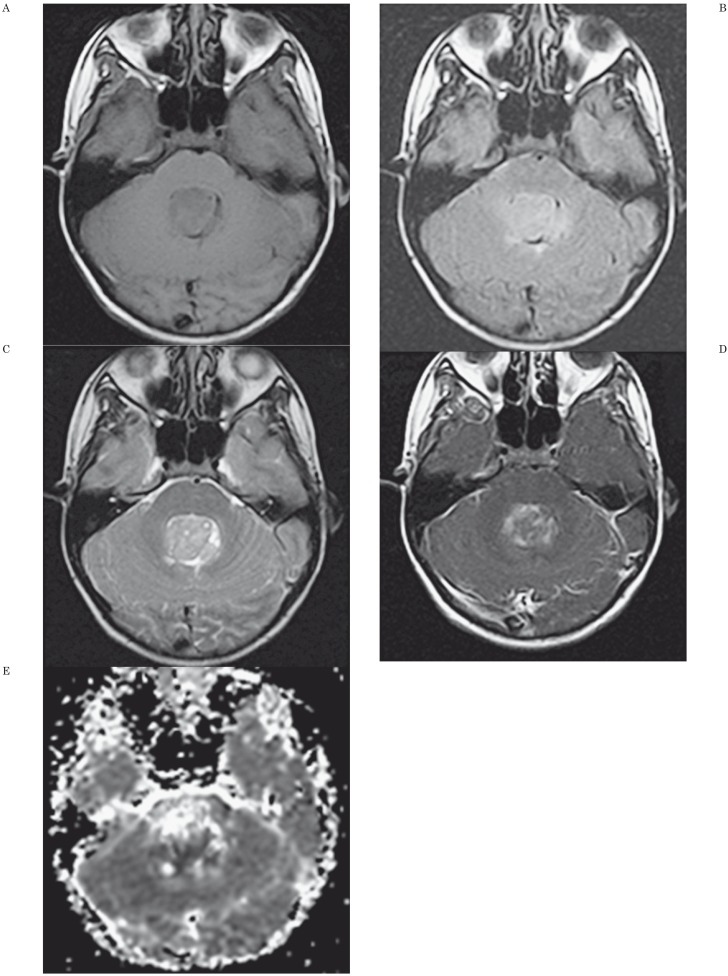
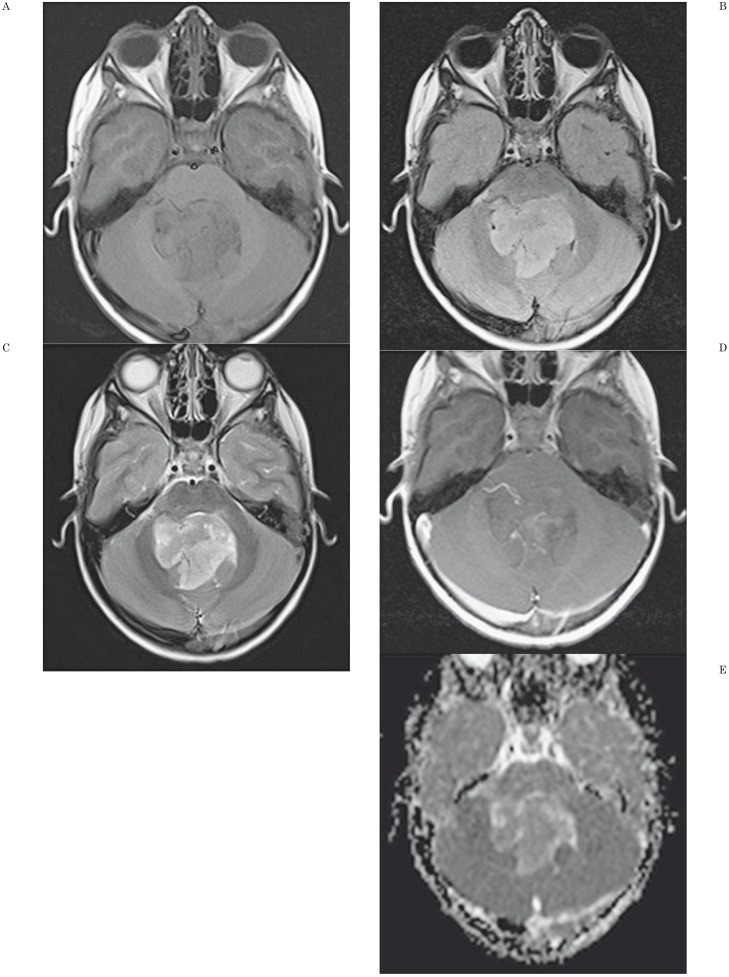
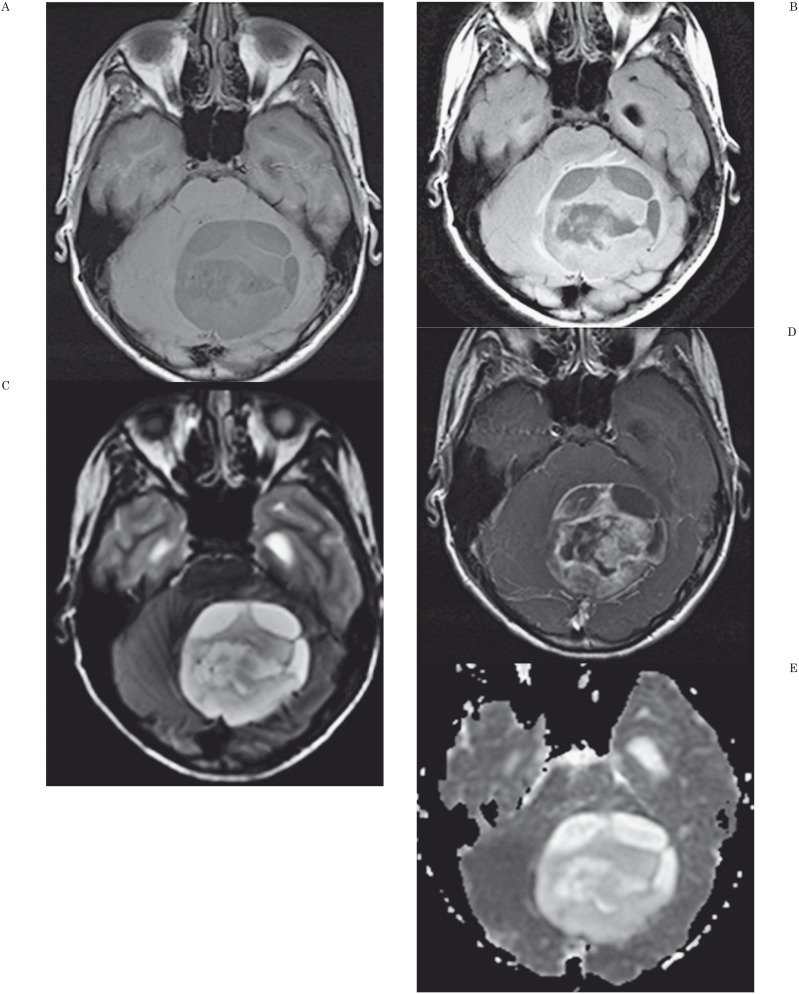
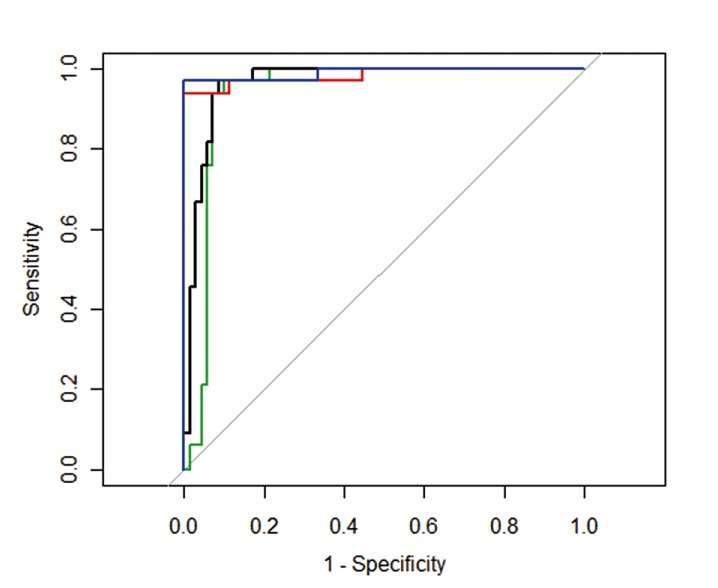
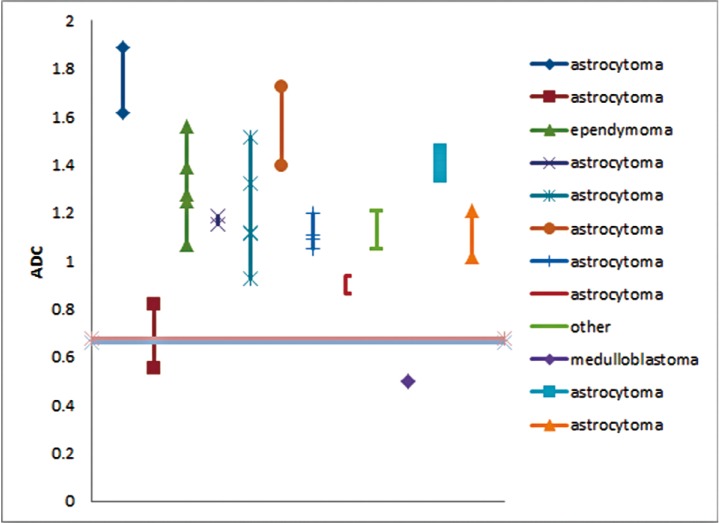
We assess a diffusion-weighted imaging (DWI) analysis technique as a potential basis for computer-aided diagnosis (CAD) of pediatric posterior fossa tumors. A retrospective medical record search identified 103 children (mean age: 87 months) with posterior fossa tumors having a total of 126 preoperative MR scans with DWI. The minimum ADC (ADCmin) and normalized ADC (nADC) values [ratio of ADCmin values in tumor compared to normal tissue] were measured by a single observer blinded to diagnosis. Receiver operating characteristic (ROC) curves were generated to determine the optimal threshold for which the nADC and ADCmin values would predict tumor histology. Inter-rater reliability for predicting tumor type was evaluated using values measured by two additional observers. At histology, ten tumor types were identified, with astrocytoma (n=50), medulloblastoma (n=33), and ependymoma (n=9) accounting for 89%. Mean ADCmin (0.54 × 10(-3) mm(2)/s) and nADC (0.70) were lowest for medulloblastoma. Mean ADCmin (1.28 × 10(-3) mm(2)/s) and nADC (1.64) were highest for astrocytoma. For the ROC analysis, the area under the curve when discriminating medulloblastoma from other tumors using nADC was 0.939 and 0.965 when using ADCmin. The optimal ADCmin threshold was 0.66 × 10(-3) mm(2)/s, which yielded an 86% positive predictive value, 97% negative predictive value, and 93% accuracy. Inter-observer variability was very low, with near perfect agreement among all observers in predicting medulloblastoma. Our data indicate that both ADCmin and nADC could serve as the basis for a CAD program to distinguish medulloblastoma from other posterior fossa tumors with a high degree of accuracy.
Keywords: apparent diffusion coefficient; computer-assisted diagnosis; medulloblastoma; posterior fossa tumor.
Figures
Similar articles
-
Use of apparent diffusion coefficient values for diagnosis of pediatric posterior fossa tumors.Neuroradiol J. 2014 Apr;27(2):233-44. doi: 10.15274/NRJ-2014-10027. Epub 2014 Apr 18. Neuroradiol J. 2014. PMID: 24750714 Free PMC article.
-
Meta-Analysis of Apparent Diffusion Coefficient in Pediatric Medulloblastoma, Ependymoma, and Pilocytic Astrocytoma.J Magn Reson Imaging. 2022 Jul;56(1):147-157. doi: 10.1002/jmri.28007. Epub 2021 Nov 29. J Magn Reson Imaging. 2022. PMID: 34842328
-
Application of Apparent Diffusion Coefficient Histogram Metrics for Differentiation of Pediatric Posterior Fossa Tumors : A Large Retrospective Study and Brief Review of Literature.Clin Neuroradiol. 2022 Dec;32(4):1097-1108. doi: 10.1007/s00062-022-01179-6. Epub 2022 Jun 8. Clin Neuroradiol. 2022. PMID: 35674799 Review.
-
Multiparametric differentiation of posterior fossa tumors in children using diffusion-weighted imaging and short echo-time 1H-MR spectroscopy.J Magn Reson Imaging. 2007 Dec;26(6):1390-8. doi: 10.1002/jmri.21185. J Magn Reson Imaging. 2007. PMID: 17968955
-
Diffusion MRI in Evaluation of Pediatric Posterior Fossa Tumors.Asian Pac J Cancer Prev. 2021 Apr 1;22(4):1129-1136. doi: 10.31557/APJCP.2021.22.4.1129. Asian Pac J Cancer Prev. 2021. PMID: 33906305 Free PMC article.
Cited by
-
Neuroradiology and histopathology in two cases of adult medulloblastoma.Neuroradiol J. 2014 Apr;27(2):163-8. doi: 10.15274/NRJ-2014-10021. Epub 2014 Apr 18. Neuroradiol J. 2014. PMID: 24750703 Free PMC article.
-
The Diagnostic Efficiency of Quantitative Diffusion Weighted Imaging in Differentiating Medulloblastoma from Posterior Fossa Tumors: A Systematic Review and Meta-Analysis.Diagnostics (Basel). 2022 Nov 15;12(11):2796. doi: 10.3390/diagnostics12112796. Diagnostics (Basel). 2022. PMID: 36428860 Free PMC article. Review.
-
Diffusion Weighted Imaging in Neuro-Oncology: Diagnosis, Post-Treatment Changes, and Advanced Sequences-An Updated Review.Cancers (Basel). 2023 Jan 19;15(3):618. doi: 10.3390/cancers15030618. Cancers (Basel). 2023. PMID: 36765575 Free PMC article. Review.
-
Volumetric voxelwise apparent diffusion coefficient histogram analysis for differentiation of the fourth ventricular tumors.Neuroradiol J. 2018 Dec;31(6):554-564. doi: 10.1177/1971400918800803. Epub 2018 Sep 19. Neuroradiol J. 2018. PMID: 30230411 Free PMC article.
-
Response assessment in medulloblastoma and leptomeningeal seeding tumors: recommendations from the Response Assessment in Pediatric Neuro-Oncology committee.Neuro Oncol. 2018 Jan 10;20(1):13-23. doi: 10.1093/neuonc/nox087. Neuro Oncol. 2018. PMID: 28449033 Free PMC article. Review.
References
-
- Doi K, MacMahon H, Katsuragawa S, et al. Computer-aided diagnosis in radiology: potential and pitfalls. Eur J Radiol. 1999;31(2):97–109. doi: /10.1016/S0720-048X(99)00016-9. - DOI - PubMed
-
- Doi K. Computer-aided diagnosis in medical imaging: historical review, current status and future potential. Comput Med Imaging Graph. 2007;31(4-5):198–211. doi: 10.1016/j.compmedimag.2007.02.002. - DOI - PMC - PubMed
-
- Eadie LH, Taylor P, Gibson AP. A systematic review of computer-assisted diagnosis in diagnostic cancer imaging. Eur J Radiol. 2012;81(1):e70–76. doi: 10.1016/j.ejrad.2011.01.098. - DOI - PubMed
-
- Emblem KE, Nedregaard B, Hald JK, et al. Automatic glioma characterization from dynamic susceptibility contrast imaging: brain tumor segmentation using knowledge-based fuzzy clustering. J Magn Reson Imaging. 2009;30(1):1–10. doi: 10.1002/jmri.21815. - DOI - PubMed
-
- Yamashita K, Yoshiura T, Arimura H, et al. Performance evaluation of radiologists with artificial neural network for differential diagnosis of intra-axial cerebral tumors on MR images. Am J Neuroradiol. 2008;29(6):1153–1158. doi: 10.3174/ajnr.A1037. - DOI - PMC - PubMed
MeSH terms
LinkOut - more resources
Full Text Sources
Other Literature Sources
Miscellaneous
