

A systems biology analysis of the unique and overlapping transcriptional responses to caloric restriction and dietary methionine restriction in rats
- PMID: 24571921
- PMCID: PMC4021438
- DOI: 10.1096/fj.14-249458
A systems biology analysis of the unique and overlapping transcriptional responses to caloric restriction and dietary methionine restriction in rats
Abstract
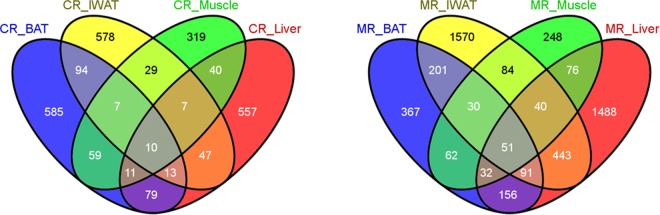
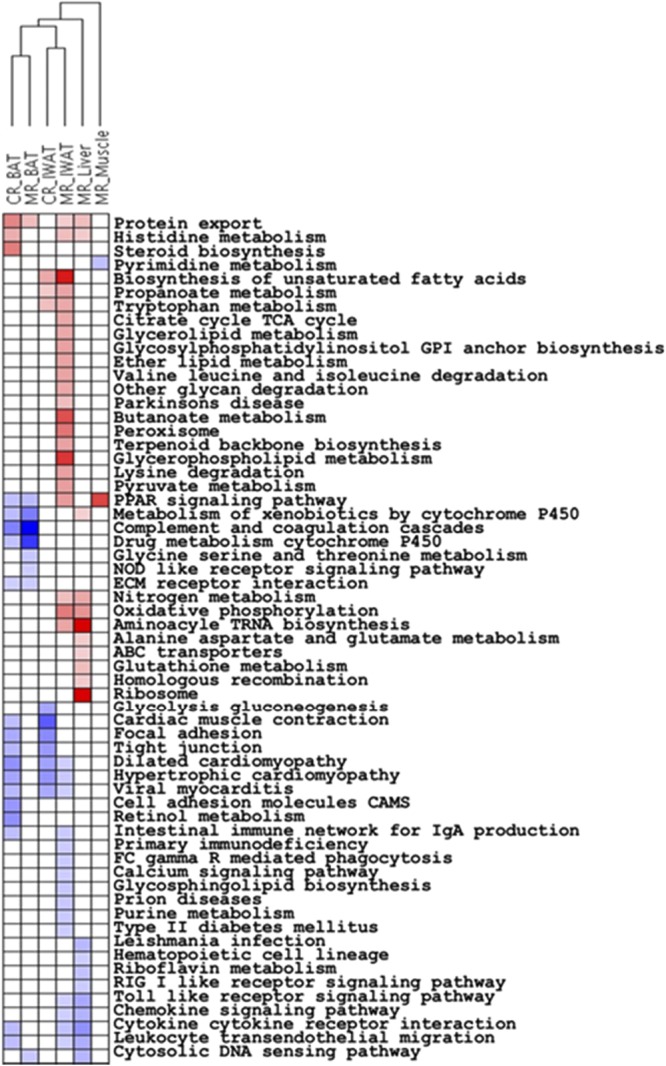
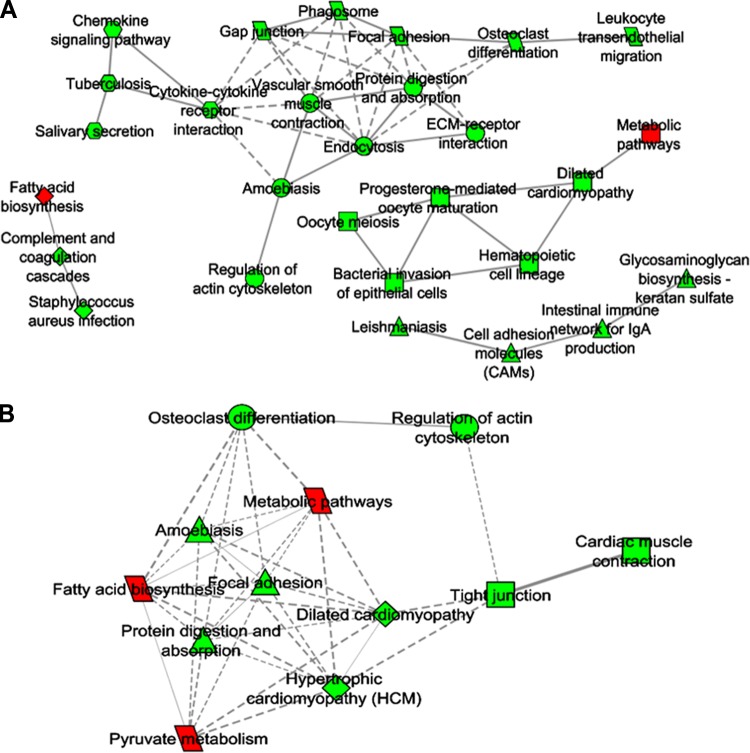
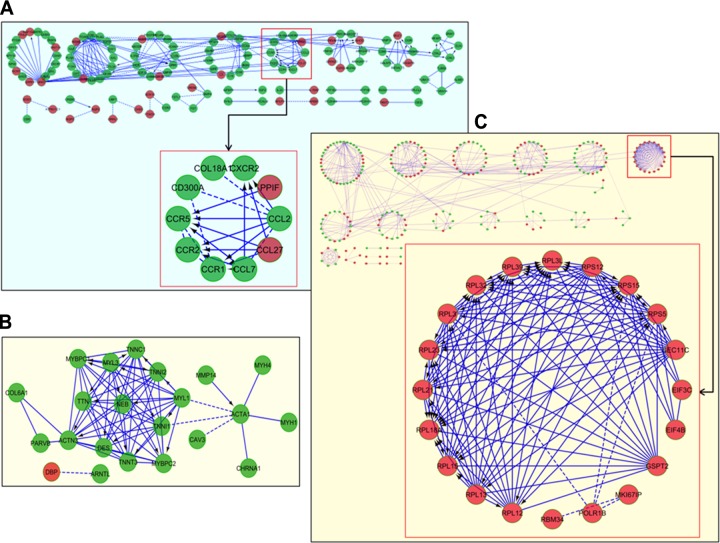
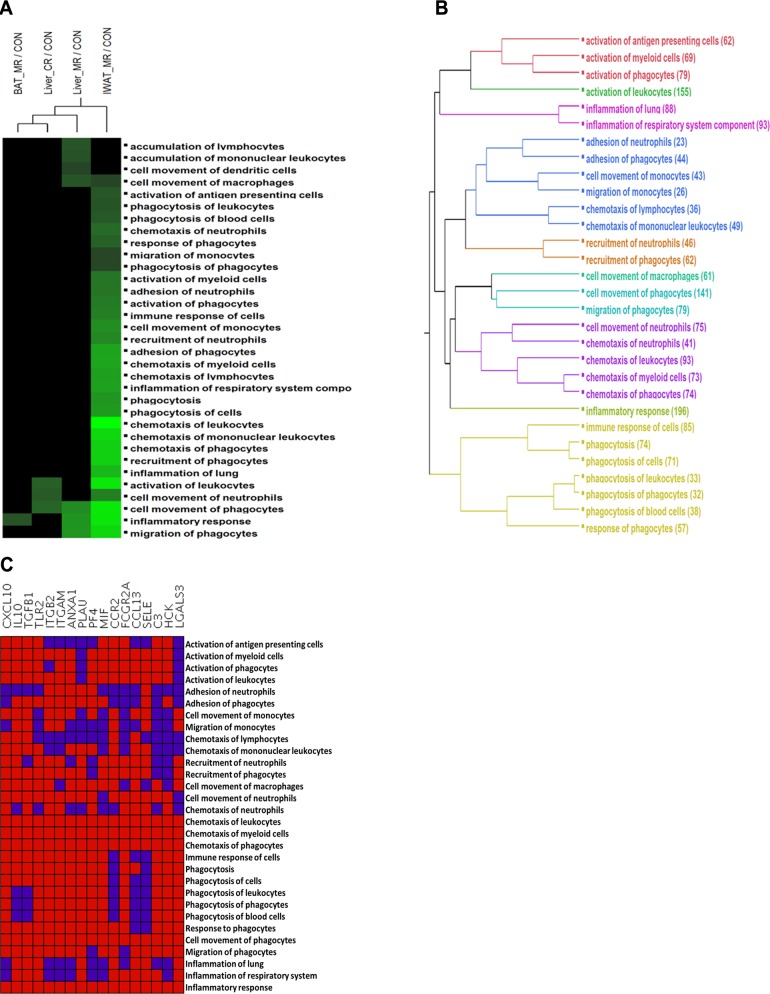
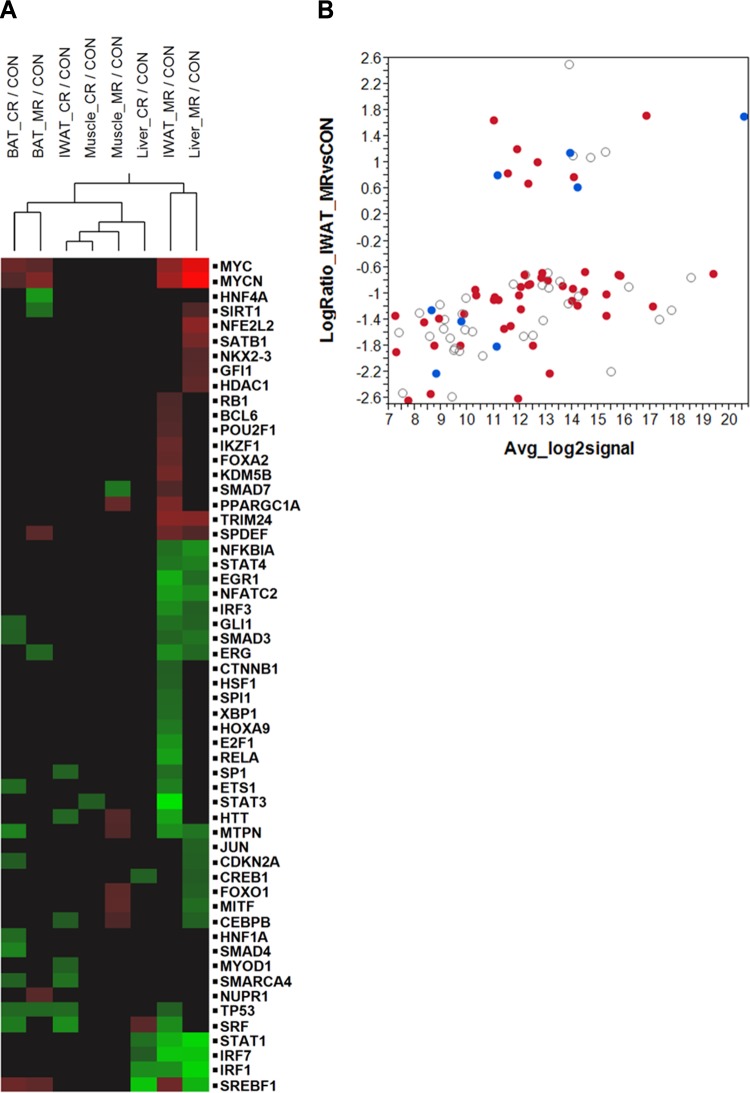
Dietary methionine restriction (MR) and calorie restriction (CR) each improve metabolic health and extend life span. We used comprehensive transcriptome profiling and systems biology analysis to interrogate the unique and overlapping molecular responses in rats provided these dietary regimens for 20 mo after weaning. Microarray analysis was conducted on inguinal white adipose (IWAT), brown adipose tissue (BAT), liver, and skeletal muscle. Compared to controls, CR-induced transcriptomic responses (absolute fold change ≥1.5 and P≤0.05) were comparable in IWAT, BAT, and liver (~800 genes). MR-induced effects were largely restricted to IWAT and liver (~2400 genes). Pathway enrichment and gene-coexpression analyses showed that induction of fatty acid synthesis in IWAT was common to CR and MR, whereas immunity and proinflammatory signaling pathways were specifically down-regulated in MR-treated IWAT and liver (FDR≤0.07-0.3). BAT demonstrated consistent down-regulation of PPAR-signaling under CR and MR, whereas muscle was largely unaffected. Interactome analysis identified CR-specific down-regulation of cytoskeletal matrix components in IWAT and MR-specific up-regulation of ribosomal genes in liver (FDR≤0.001). Transcriptomic down-regulation of inflammation genes by MR in IWAT was consistent with upstream inhibition of STAT3. Together, these results provide an integrated picture of the breadth of transcriptional responses to MR and CR among key metabolic tissues.
Keywords: amino acid sensing; animal models; insulin sensitivity; obesity.
© FASEB.
Figures
Similar articles
-
Transcriptional impact of dietary methionine restriction on systemic inflammation: relevance to biomarkers of metabolic disease during aging.Biofactors. 2014 Jan-Feb;40(1):13-26. doi: 10.1002/biof.1111. Epub 2013 Jun 29. Biofactors. 2014. PMID: 23813805 Free PMC article. Review.
-
Depot-specific regulation of NAD+/SIRTs metabolism identified in adipose tissue of mice in response to high-fat diet feeding or calorie restriction.J Nutr Biochem. 2020 Jun;80:108377. doi: 10.1016/j.jnutbio.2020.108377. Epub 2020 Mar 19. J Nutr Biochem. 2020. PMID: 32278117
-
Differential Responses of White Adipose Tissue and Brown Adipose Tissue to Calorie Restriction During Aging.J Gerontol A Biol Sci Med Sci. 2021 Feb 25;76(3):393-399. doi: 10.1093/gerona/glaa070. J Gerontol A Biol Sci Med Sci. 2021. PMID: 32222773
-
Genomic and metabolic responses to methionine-restricted and methionine-restricted, cysteine-supplemented diets in Fischer 344 rat inguinal adipose tissue, liver and quadriceps muscle.J Nutrigenet Nutrigenomics. 2012;5(3):132-57. doi: 10.1159/000339347. Epub 2012 Oct 9. J Nutrigenet Nutrigenomics. 2012. PMID: 23052097
-
Strain-specific metabolic responses to long-term caloric restriction in female ILSXISS recombinant inbred mice.Mol Cell Endocrinol. 2021 Sep 15;535:111376. doi: 10.1016/j.mce.2021.111376. Epub 2021 Jul 9. Mol Cell Endocrinol. 2021. PMID: 34246728 Free PMC article. Review.
Cited by
-
Protein-dependent regulation of feeding and metabolism.Trends Endocrinol Metab. 2015 May;26(5):256-62. doi: 10.1016/j.tem.2015.02.008. Epub 2015 Mar 11. Trends Endocrinol Metab. 2015. PMID: 25771038 Free PMC article. Review.
-
Homeostatic sensing of dietary protein restriction: A case for FGF21.Front Neuroendocrinol. 2018 Oct;51:125-131. doi: 10.1016/j.yfrne.2018.06.002. Epub 2018 Jun 8. Front Neuroendocrinol. 2018. PMID: 29890191 Free PMC article. Review.
-
Nutritional Regulation of Hepatic FGF21 by Dietary Restriction of Methionine.Front Endocrinol (Lausanne). 2021 Nov 30;12:773975. doi: 10.3389/fendo.2021.773975. eCollection 2021. Front Endocrinol (Lausanne). 2021. PMID: 34917032 Free PMC article. Review.
-
Genetic and metabolomic architecture of variation in diet restriction-mediated lifespan extension in Drosophila.PLoS Genet. 2020 Jul 9;16(7):e1008835. doi: 10.1371/journal.pgen.1008835. eCollection 2020 Jul. PLoS Genet. 2020. PMID: 32644988 Free PMC article.
-
Whole-transcriptome analysis of mouse adipose tissue in response to short-term caloric restriction.Mol Genet Genomics. 2016 Apr;291(2):831-47. doi: 10.1007/s00438-015-1150-3. Epub 2015 Nov 25. Mol Genet Genomics. 2016. PMID: 26606930
References
-
- Deyl Z., Juricova M., Stuchlikova E. (1975) The effect of nutritional regimes upon collagen concentration and survival of rats. Adv. Exp. Med. Biol. 53, 359–369 - PubMed
-
- McCay C. M., Crowell M. F., Maynard L. A. (1989) The effect of retarded growth upon the length of life span and upon the ultimate body size. 1935. Nutrition 5, 155–171 - PubMed
-
- Richie J. P., Jr., Leutzinger Y., Parthasarathy S., Malloy V., Orentreich N., Zimmerman J. A. (1994) Methionine restriction increases blood glutathione and longevity in F344 rats. FASEB J. 8, 1302–1307 - PubMed
-
- Orentreich N., Matias J. R., DeFelice A., Zimmerman J. A. (1993) Low methionine ingestion by rats extends life span. J. Nutr. 123, 269–274 - PubMed
Publication types
MeSH terms
Substances
Grants and funding
LinkOut - more resources
Full Text Sources
Other Literature Sources
Miscellaneous
