

Increased substitution rates surrounding low-complexity regions within primate proteins
- PMID: 24572016
- PMCID: PMC3971593
- DOI: 10.1093/gbe/evu042
Increased substitution rates surrounding low-complexity regions within primate proteins
Abstract
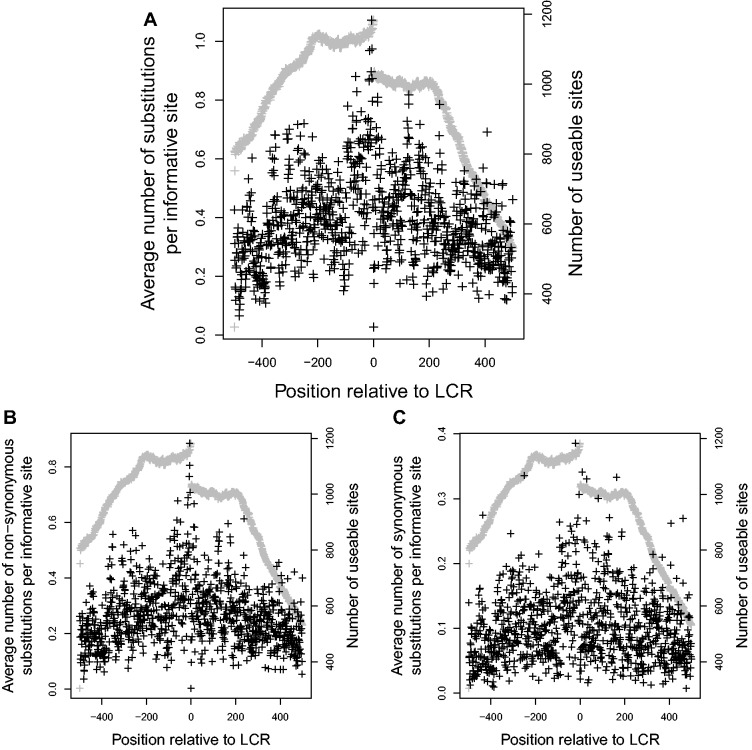
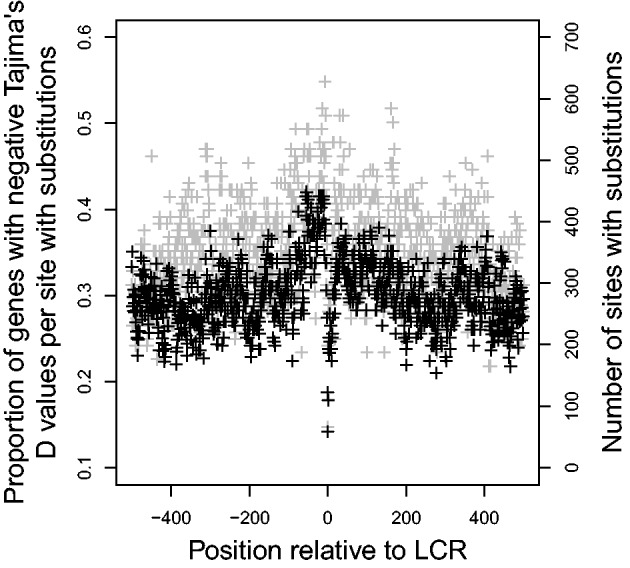
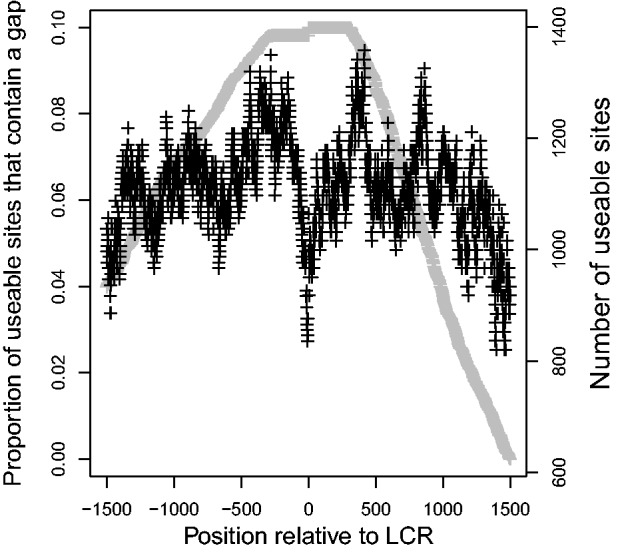
Previous studies have found that DNA-flanking low-complexity regions (LCRs) have an increased substitution rate. Here, the substitution rate was confirmed to increase in the vicinity of LCRs in several primate species, including humans. This effect was also found among human sequences from the 1000 Genomes Project. A strong correlation was found between average substitution rate per site and distance from the LCR, as well as the proportion of genes with gaps in the alignment at each site and distance from the LCR. Along with substitution rates, dN/dS ratios were also determined for each site, and the proportion of sites undergoing negative selection was found to have a negative relationship with distance from the LCR.
Keywords: low-complexity region; mutation; primate; substitution.
Figures
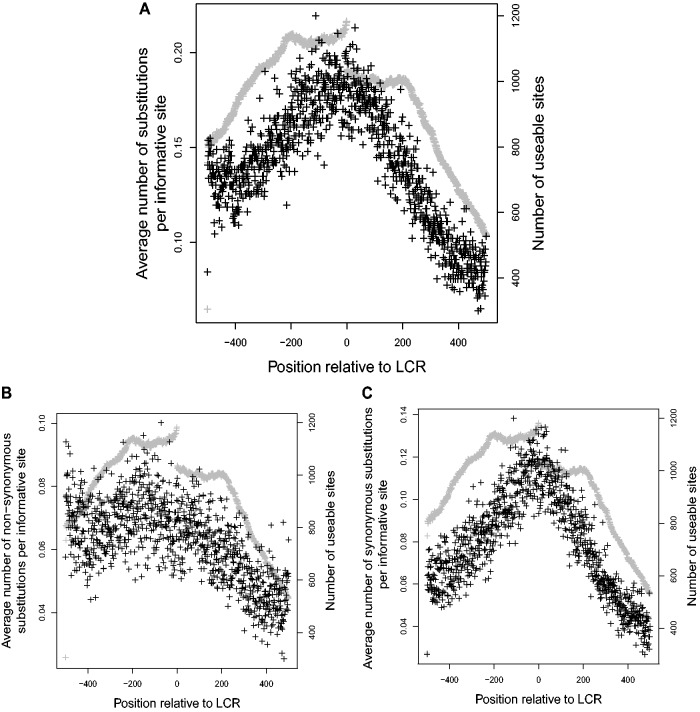

 ). Gray points indicate the number of genes that had substitutions and could be used to calculate dN/dS. Negative values are upstream of the LCR.
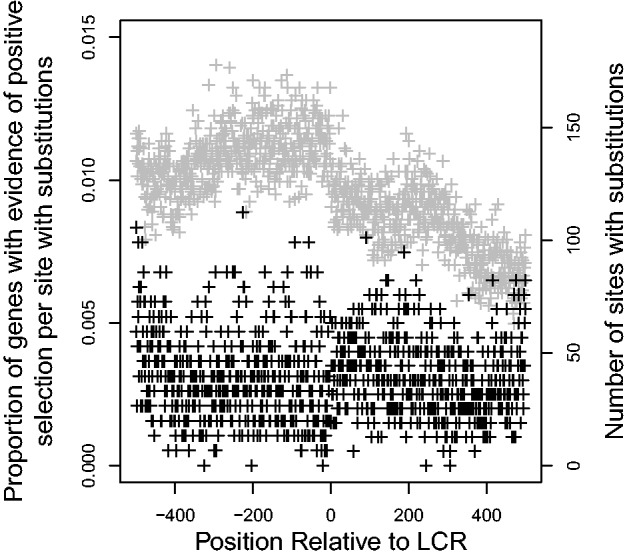
Similar articles
-
Divergence of the genes on human chromosome 21 between human and other hominoids and variation of substitution rates among transcription units.Proc Natl Acad Sci U S A. 2003 Jul 8;100(14):8331-6. doi: 10.1073/pnas.1332748100. Epub 2003 Jun 25. Proc Natl Acad Sci U S A. 2003. PMID: 12826612 Free PMC article.
-
Molecular systematics of higher primates: genealogical relations and classification.Proc Natl Acad Sci U S A. 1988 Oct;85(20):7627-31. doi: 10.1073/pnas.85.20.7627. Proc Natl Acad Sci U S A. 1988. PMID: 3174657 Free PMC article.
-
SSADH variation in primates: intra- and interspecific data on a gene with a potential role in human cognitive functions.J Mol Evol. 2006 Jul;63(1):54-68. doi: 10.1007/s00239-005-0154-8. Epub 2006 Jun 17. J Mol Evol. 2006. PMID: 16786440
-
Molecular evolution of the human chromosome 15 pericentromeric region.Cytogenet Genome Res. 2005;108(1-3):73-82. doi: 10.1159/000080804. Cytogenet Genome Res. 2005. PMID: 15545718
-
Understanding Language Evolution: Beyond Pan-Centrism.Bioessays. 2020 Mar;42(3):e1900102. doi: 10.1002/bies.201900102. Epub 2020 Jan 29. Bioessays. 2020. PMID: 31994246 Review.
Cited by
-
Identification of a novel deletion in the MMAA gene in two Iranian siblings with vitamin B12-responsive methylmalonic acidemia.Cell Mol Biol Lett. 2016 Jul 28;21:4. doi: 10.1186/s11658-016-0005-1. eCollection 2016. Cell Mol Biol Lett. 2016. PMID: 28536607 Free PMC article.
-
Characterizing features affecting local ancestry inference performance in admixed populations.bioRxiv [Preprint]. 2024 Aug 27:2024.08.26.609770. doi: 10.1101/2024.08.26.609770. bioRxiv. 2024. Update in: Am J Hum Genet. 2025 Feb 06;112(2):224-234. doi: 10.1016/j.ajhg.2024.12.005. PMID: 39253486 Free PMC article. Updated. Preprint.
-
Common low complexity regions for SARS-CoV-2 and human proteomes as potential multidirectional risk factor in vaccine development.BMC Bioinformatics. 2021 Apr 8;22(1):182. doi: 10.1186/s12859-021-04017-7. BMC Bioinformatics. 2021. PMID: 33832440 Free PMC article.
-
Divergent evolution of low-complexity regions in the vertebrate CPEB protein family.Front Bioinform. 2025 Mar 20;5:1491735. doi: 10.3389/fbinf.2025.1491735. eCollection 2025. Front Bioinform. 2025. PMID: 40182702 Free PMC article.
-
Regions with two amino acids in protein sequences: A step forward from homorepeats into the low complexity landscape.Comput Struct Biotechnol J. 2022 Sep 18;20:5516-5523. doi: 10.1016/j.csbj.2022.09.011. eCollection 2022. Comput Struct Biotechnol J. 2022. PMID: 36249567 Free PMC article.
References
-
- Alba M, Santibanez-Koref M, Hancock J. Conservation of polyglutamine tract size between mice and humans depends on codon interruption. Mol Biol Evol. 1999;16:1641–1644. - PubMed
-
- Alba M, Santibanez-Koref M, Hancock J. The comparative genomics of polyglutamine repeats: extreme differences in the codon organization of repeat-encoding regions between mammals and Drosophila. J Mol Evol. 2001;52:249–259. - PubMed
Publication types
MeSH terms
Substances
LinkOut - more resources
Full Text Sources
Other Literature Sources
