Ascidian mitogenomics: comparison of evolutionary rates in closely related taxa provides evidence of ongoing speciation events
- PMID: 24572017
- PMCID: PMC3971592
- DOI: 10.1093/gbe/evu041
Ascidian mitogenomics: comparison of evolutionary rates in closely related taxa provides evidence of ongoing speciation events
Erratum in
- Genome Biol Evol. 2014 Apr;6(4):931. Xavier, Turon [corrected to Turon, Xavier]
Abstract
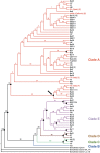
Ascidians are a fascinating group of filter-feeding marine chordates characterized by rapid evolution of both sequences and structure of their nuclear and mitochondrial genomes. Moreover, they include several model organisms used to investigate complex biological processes in chordates. To study the evolutionary dynamics of ascidians at short phylogenetic distances, we sequenced 13 new mitogenomes and analyzed them, together with 15 other available mitogenomes, using a novel approach involving detailed whole-mitogenome comparisons of conspecific and congeneric pairs. The evolutionary rate was quite homogeneous at both intraspecific and congeneric level, and the lowest congeneric rates were found in cryptic (morphologically undistinguishable) and in morphologically very similar species pairs. Moreover, congeneric nonsynonymous rates (dN) were up to two orders of magnitude higher than in intraspecies pairs. Overall, a clear-cut gap sets apart conspecific from congeneric pairs. These evolutionary peculiarities allowed easily identifying an extraordinary intraspecific variability in the model ascidian Botryllus schlosseri, where most pairs show a dN value between that observed at intraspecies and congeneric level, yet consistently lower than that of the Ciona intestinalis cryptic species pair. These data suggest ongoing speciation events producing genetically distinct B. schlosseri entities. Remarkably, these ongoing speciation events were undetectable by the cox1 barcode fragment, demonstrating that, at low phylogenetic distances, the whole mitogenome has a higher resolving power than cox1. Our study shows that whole-mitogenome comparative analyses, performed on a suitable sample of congeneric and intraspecies pairs, may allow detecting not only cryptic species but also ongoing speciation events.
Keywords: ascidian; evolutionary rate; mitochondrial genome; species identification.
Figures


Similar articles
-
Cryptic speciation in a model invertebrate chordate.Proc Natl Acad Sci U S A. 2007 May 29;104(22):9364-9. doi: 10.1073/pnas.0610158104. Epub 2007 May 21. Proc Natl Acad Sci U S A. 2007. PMID: 17517633 Free PMC article.
-
The mitochondrial genome of Phallusia mammillata and Phallusia fumigata (Tunicata, Ascidiacea): high genome plasticity at intra-genus level.BMC Evol Biol. 2007 Aug 31;7:155. doi: 10.1186/1471-2148-7-155. BMC Evol Biol. 2007. PMID: 17764550 Free PMC article.
-
Tunicate mitogenomics and phylogenetics: peculiarities of the Herdmania momus mitochondrial genome and support for the new chordate phylogeny.BMC Genomics. 2009 Nov 17;10:534. doi: 10.1186/1471-2164-10-534. BMC Genomics. 2009. PMID: 19922605 Free PMC article.
-
Evolution of the mitochondrial genome of Metazoa as exemplified by comparison of congeneric species.Heredity (Edinb). 2008 Oct;101(4):301-20. doi: 10.1038/hdy.2008.62. Epub 2008 Jul 9. Heredity (Edinb). 2008. PMID: 18612321 Review.
-
The Ciona intestinalis genome: when the constraints are off.Bioessays. 2003 Jun;25(6):529-32. doi: 10.1002/bies.10302. Bioessays. 2003. PMID: 12766941 Review.
Cited by
-
Hidden diversity in Antarctica: Molecular and morphological evidence of two different species within one of the most conspicuous ascidian species.Ecol Evol. 2020 Jul 15;10(15):8127-8143. doi: 10.1002/ece3.6504. eCollection 2020 Aug. Ecol Evol. 2020. PMID: 32788966 Free PMC article.
-
Interplays between cis- and trans-Acting Factors for Alternative Splicing in Response to Environmental Changes during Biological Invasions of Ascidians.Int J Mol Sci. 2023 Oct 5;24(19):14921. doi: 10.3390/ijms241914921. Int J Mol Sci. 2023. PMID: 37834365 Free PMC article.
-
Invertebrates as model organisms for research on aging biology.Invertebr Reprod Dev. 2015 Jan 30;59(sup1):1-4. doi: 10.1080/07924259.2014.970002. Epub 2014 Dec 9. Invertebr Reprod Dev. 2015. PMID: 26241448 Free PMC article.
-
The first representative of Coelomactra antiquata mitochondrial genome from Liaoning (China) and phylogenetic consideration.Mitochondrial DNA B Resour. 2016 Jul 23;1(1):525-527. doi: 10.1080/23802359.2016.1197064. Mitochondrial DNA B Resour. 2016. PMID: 33473543 Free PMC article.
-
Investigating the widespread introduction of a tropical marine fouling species.Ecol Evol. 2016 Mar 11;6(8):2453-71. doi: 10.1002/ece3.2065. eCollection 2016 Apr. Ecol Evol. 2016. PMID: 27066231 Free PMC article.
References
-
- Botero-Castro F, et al. Next-generation sequencing and phylogenetic signal of complete mitochondrial genomes for resolving the evolutionary history of leaf-nosed bats (Phyllostomidae) Mol Phylogenet Evol. 2013;10:278–279. - PubMed
-
- Bourlat SJ, et al. Deuterostome phylogeny reveals monophyletic chordates and the new phylum Xenoturbellida. Nature. 2006;444:85–88. - PubMed
-
- Boyd HC, Weissman IL, Saito Y. Morphologic and genetic verification that Monterey Botryllus and Woods Hole Botryllus are the same species. Biol Bull. 1990;178:239–250. - PubMed
-
- Brunetti R. Botryllid species (Tunicata, Ascidiacea) from the Mediterranean coast of Israel, with some considerations on the systematics of Botryllinae. Zootaxa. 2009;2289:18–32.
Publication types
MeSH terms
Substances
Associated data
- Actions
- Actions
- Actions
- Actions
- Actions
- Actions
- Actions
- Actions
- Actions
- Actions
- Actions
Grants and funding
LinkOut - more resources
Full Text Sources
Other Literature Sources
Molecular Biology Databases
Miscellaneous

