

Prestimulus frontal-parietal coherence predicts auditory detection performance in rats
- PMID: 24572093
- PMCID: PMC4044341
- DOI: 10.1152/jn.00781.2012
Prestimulus frontal-parietal coherence predicts auditory detection performance in rats
Abstract
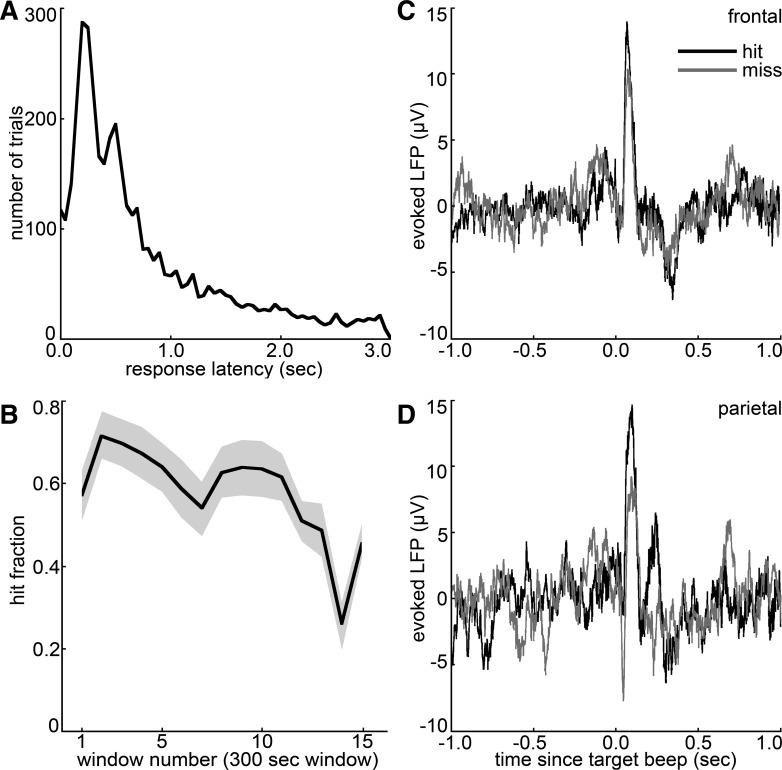
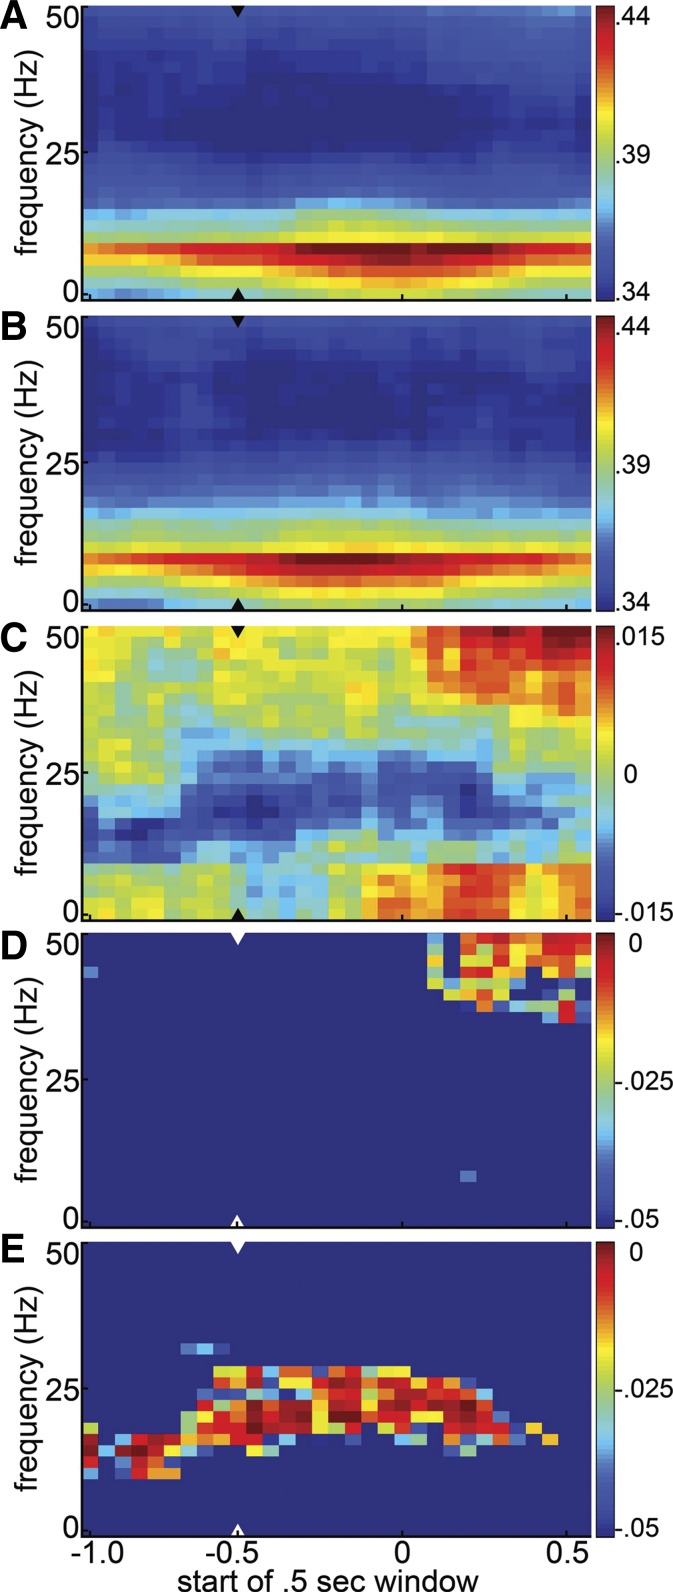
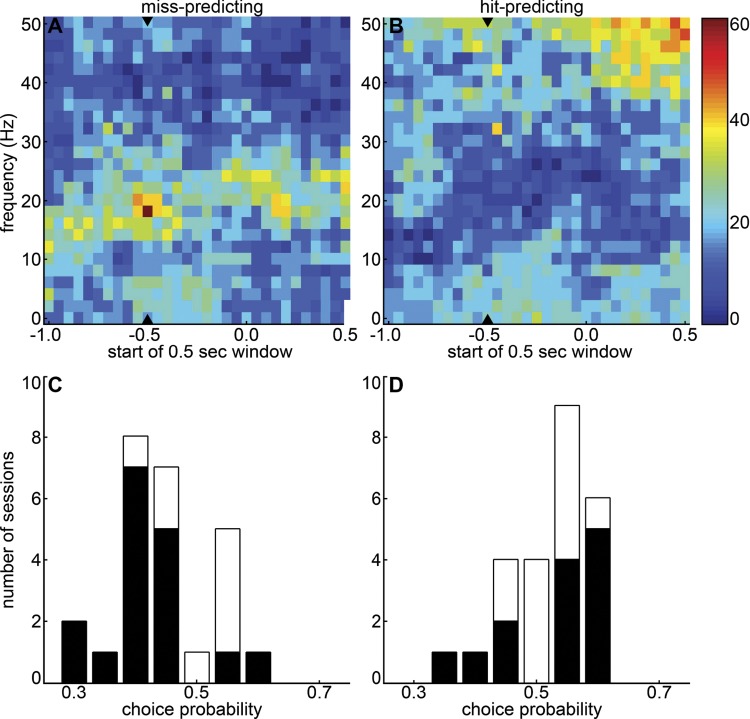
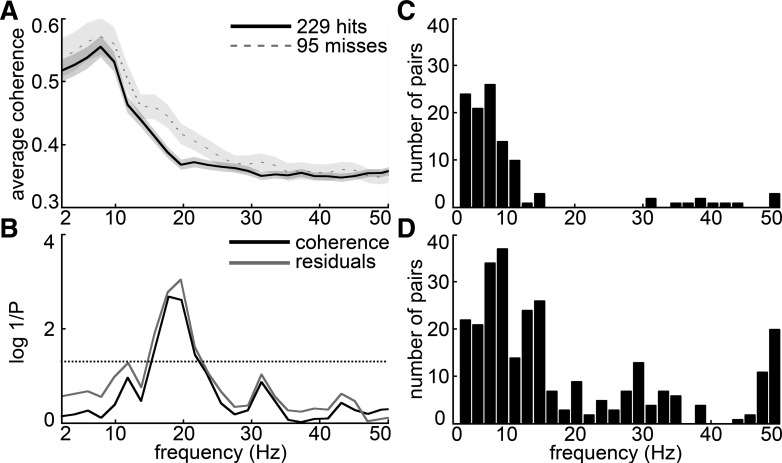
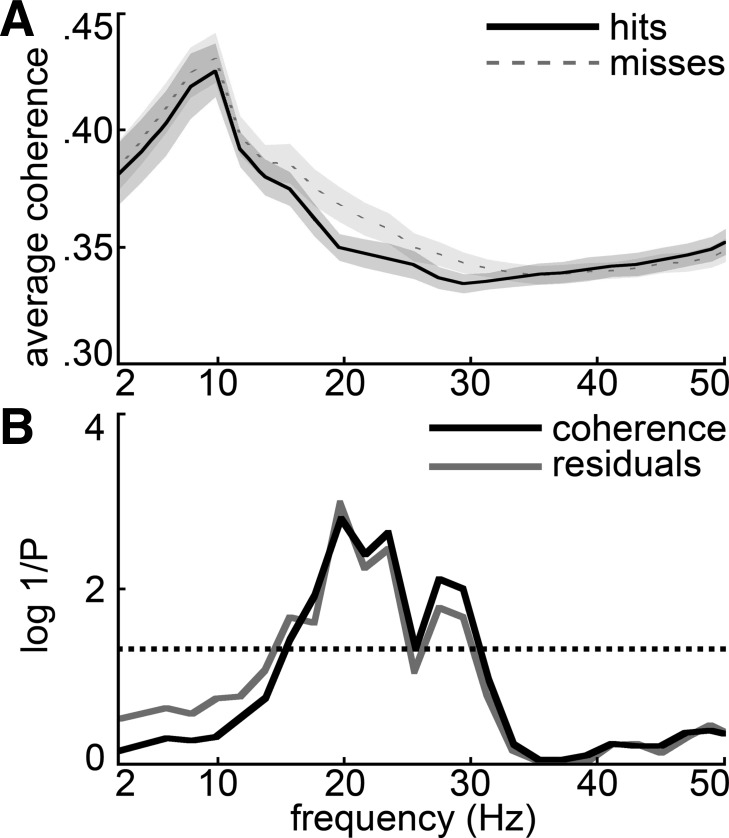
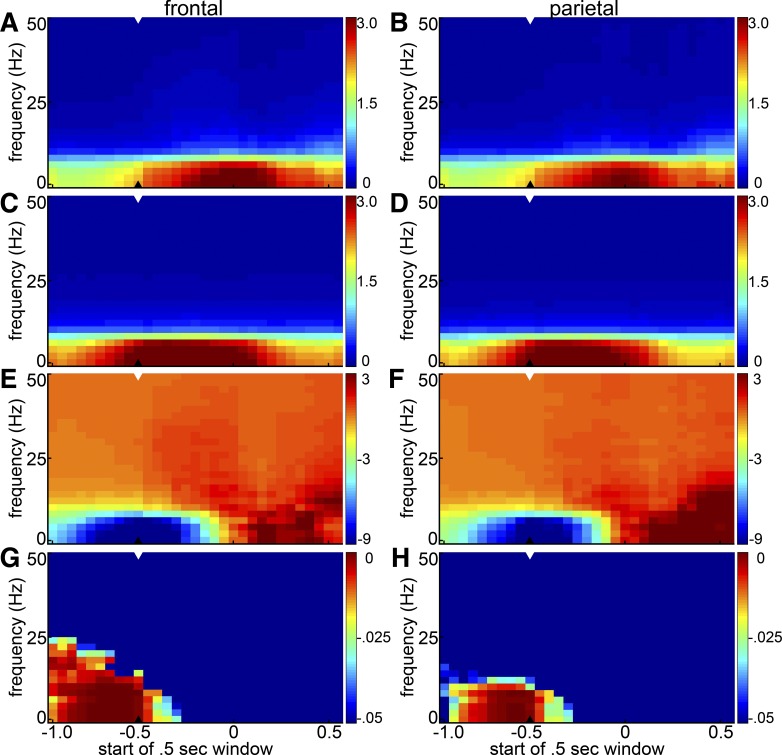
Electrophysiology in primates has implicated long-range neural coherence as a potential mechanism for enhancing sensory detection. To test whether local synchronization and long-range neural coherence support detection performance in rats, we recorded local field potentials (LFPs) in frontal and parietal cortex while rats performed an auditory detection task. We observed significantly elevated power at multiple low frequencies (<15 Hz) preceding the target beep when the animal failed to respond to the signal (misses), in both frontal and parietal cortex. In terms of long-range coherence, we observed significantly more frontal-parietal coherence in the beta band (15-30 Hz) before the signal on misses compared with hits. This effect persisted after regressing away linear trends in the coherence values during a session, showing that the excess frontal-parietal beta coherence prior to misses cannot be explained by slow motivational changes during a session. In addition, a trend toward higher low-frequency (<15 Hz) coherence prior to miss trials compared with hits became highly significant when we rereferenced the LFPs to the mean voltage on each recording array, suggesting that the results are specific to our frontal and parietal areas. These results do not support a role for long-range frontal-parietal coherence or local synchronization in facilitating the detection of external stimuli. Rather, they extend to long-range frontal-parietal coherence previous findings that correlate local synchronization of low-frequency (<15 Hz) oscillations with inattention to external stimuli and synchronization of beta rhythms (15-30 Hz) with voluntary or involuntary prolongation of the current cognitive or motor state.
Keywords: attention; oscillation; synchrony.
Copyright © 2014 the American Physiological Society.
Figures
Similar articles
-
Cholinergic Modulation of Frontoparietal Cortical Network Dynamics Supporting Supramodal Attention.J Neurosci. 2018 Apr 18;38(16):3988-4005. doi: 10.1523/JNEUROSCI.2350-17.2018. Epub 2018 Mar 23. J Neurosci. 2018. PMID: 29572433 Free PMC article.
-
Inferior-frontal cortex phase synchronizes with the temporal-parietal junction prior to successful change detection.Neuroimage. 2015 Oct 1;119:417-31. doi: 10.1016/j.neuroimage.2015.06.043. Epub 2015 Jun 26. Neuroimage. 2015. PMID: 26119023
-
Sevoflurane Induces Coherent Slow-Delta Oscillations in Rats.Front Neural Circuits. 2017 Jul 4;11:36. doi: 10.3389/fncir.2017.00036. eCollection 2017. Front Neural Circuits. 2017. PMID: 28725184 Free PMC article.
-
Coherence and Consciousness: Study of Fronto-Parietal Gamma Synchrony in Patients with Disorders of Consciousness.Brain Topogr. 2015 Jul;28(4):570-9. doi: 10.1007/s10548-014-0383-5. Epub 2014 Jul 29. Brain Topogr. 2015. PMID: 25070585
-
Cortical Local Field Potential Power Is Associated with Behavioral Detection of Near-threshold Stimuli in the Rat Whisker System: Dissociation between Orbitofrontal and Somatosensory Cortices.J Cogn Neurosci. 2018 Jan;30(1):42-49. doi: 10.1162/jocn_a_01187. Epub 2017 Sep 11. J Cogn Neurosci. 2018. PMID: 28891783
Cited by
-
Mouse mutants in schizophrenia risk genes GRIN2A and AKAP11 show EEG abnormalities in common with schizophrenia patients.Transl Psychiatry. 2023 Mar 13;13(1):92. doi: 10.1038/s41398-023-02393-7. Transl Psychiatry. 2023. PMID: 36914641 Free PMC article.
-
Frequency-specific coupling in fronto-parieto-occipital cortical circuits underlie active tactile discrimination.Sci Rep. 2019 Mar 25;9(1):5105. doi: 10.1038/s41598-019-41516-3. Sci Rep. 2019. PMID: 30911025 Free PMC article.
-
Evoked Frontal and Parietal Field Potential Signatures of Target Detection and Response Inhibition in Rats Performing an Equiprobable Auditory Go/No-Go Task.eNeuro. 2020 Jan 3;7(1):ENEURO.0055-19.2019. doi: 10.1523/ENEURO.0055-19.2019. Print 2020 Jan/Feb. eNeuro. 2020. PMID: 31767572 Free PMC article.
-
Cholinergic Modulation of Frontoparietal Cortical Network Dynamics Supporting Supramodal Attention.J Neurosci. 2018 Apr 18;38(16):3988-4005. doi: 10.1523/JNEUROSCI.2350-17.2018. Epub 2018 Mar 23. J Neurosci. 2018. PMID: 29572433 Free PMC article.
-
Associations of Alpha and Beta Interhemispheric EEG Coherences with Indices of Attentional Control and Academic Performance.Behav Neurol. 2020 Feb 5;2020:4672340. doi: 10.1155/2020/4672340. eCollection 2020. Behav Neurol. 2020. PMID: 32089751 Free PMC article.
References
-
- Alonso A, Garcia-Austt E. Neuronal sources of theta rhythm in the entorhinal cortex of the rat. I. Laminar distribution of theta field potentials. Exp Brain Res 67: 493–501, 1987 - PubMed
-
- Barry RJ, Clarke AR, Hajos M, Dupuy FE, McCarthy R, Selikowitz M. EEG coherence and symptom profiles of children with Attention-Deficit/Hyperactivity Disorder. Clin Neurophysiol 122: 1327–1332, 2011 - PubMed
-
- Benchenane K, Tiesinga PH, Battaglia FP. Oscillations in the prefrontal cortex: a gateway to memory and attention. Curr Opin Neurobiol 21: 475–485, 2011 - PubMed
Publication types
MeSH terms
Grants and funding
LinkOut - more resources
Full Text Sources
Other Literature Sources