. 2014 Apr;164(4):1789-99.
doi: 10.1104/pp.114.237511. Epub 2014 Feb 26.

Down-regulation of plasma intrinsic protein1 aquaporin in poplar trees is detrimental to recovery from embolism

Affiliations

Down-regulation of plasma intrinsic protein1 aquaporin in poplar trees is detrimental to recovery from embolism

Francesca Secchi et al. Plant Physiol. 2014 Apr.

Abstract

During their lifecycles, trees encounter multiple events of water stress that often result in embolism formation and temporal decreases in xylem transport capacity. The restoration of xylem transport capacity requires changes in cell metabolic activity and gene expression. Specifically, in poplar (Populus spp.), the formation of xylem embolisms leads to a clear up-regulation of plasma membrane protein1 (PIP1) aquaporin genes. To determine their role in poplar response to water stress, transgenic Populus tremula × Populus alba plants characterized by the strong down-regulation of multiple isoforms belonging to the PIP1 subfamily were used. Transgenic lines showed that they are more vulnerable to embolism, with 50% percent loss of conductance occurring 0.3 MPa earlier than in wild-type plants, and that they also have a reduced capacity to restore xylem conductance during recovery. Transgenic plants also show symptoms of a reduced capacity to control percent loss of conductance through stomatal conductance in response to drought, because they have a much narrower vulnerability safety margin. Finally, a delay in stomatal conductance recovery during the period of stress relief was observed. The presented results suggest that PIP1 genes are involved in the maintenance of xylem transport system capacity, in the promotion of recovery from stress, and in contribution to a plant's control of stomatal conductance under water stress.


Figures

Figure 1.
Figure 1.
Relative gene expression of the PIP1 subfamily in the stems of wild type (wt) and five transgenic lines (1–5). Each histogram is the average of three independent biological samples with two technical replicates; the error bars represent se. The one-way ANOVA test suggests significant differences between plant groups (P < 0.001). Letters denote homogeneous groups based on the Fisher lsd test; no differences were observed among the transformed plants (1–5).
Figure 2.
Figure 2.
Relative expression levels of the PIP1 subfamily gene (transgenic construct), PIP1s (1–5), and PIP2s (1–7) genes for pooled transgenic P. tremula × P. alba stems tested against expression level in wt stems. Data are mean values, and the error bars represent se. Letters denote homogeneous groups based on the Fisher lsd corrected for the multiple comparisons. ANOVA test revealed the presence of significant differences for all PIP1 genes tested (P < 0.001), whereas no differences were founded among all PIP2 genes tested in transgenic compared with wt plants.
Figure 3.
Figure 3.
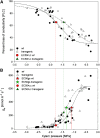
A, PLC in stems and gs (B) of wt and transgenic lines in relation to xylem pressure. Data were fitted with the four-parameter logistic curves (dose-response curve; black lines for wt and dashed black lines for transgenic) in the form of PLC = minPLC + (maxPLC − minPLC)/(1 + (Ψ/EC50PLC)slope)), where minPLC was the minimum PLC in well-watered plants, maxPLC was 100%, EC50PLC represents a 50% loss of initial functionality [(minPLC + (maxPLC − minPLC); half-maximal effective concentration; in our case, effective xylem pressure), and slope is the rate of PLC increase at EC50PLC. The same function was used to fit the gs response to stem water pressure. Red circles/dashed lines and green triangles/dashed lines represent EC50PLC for wt and transgenic plants, respectively, whereas red star/line and green star/line represent a 50% loss of initial gs (EC50gs) for wt and transgenic plants, respectively. Parameters that describe curves for the two populations of plants are statistically different (wt EC50PLC = −1.756 and transgenic EC50PLC = −1.432; Student’s t test, P < 0.0025; wt EC50gs = −1.102 and transgenic EC50gs = −1.316, Student’s t test, P < 0.025). [See online article for color version of this figure.]
Figure 4.
Figure 4.
Changes in osmotic potential (sugar + ion) of xylem sap collected from functional vessels (lightly colored circles, wt; lightly colored triangles, transgenic) under different levels of xylem pressure (balancing pressure). Dark circles (wt ) and dark triangles (transgenic) represent average values for three groups of plants of well-watered, moderately stressed (Px < EC50PLC), and severely stressed (Px > EC50PLC) plants. The one-way ANOVA test suggests significant differences between treatments and lines (P < 0.001). Letters denote homogeneous groups based on the Fisher lsd test. [See online article for color version of this figure.]
Figure 5.
Figure 5.
PLC and xylem pressure recovery (rec) from moderate (Px < EC50PLC) and severe (Px > EC50PLC) water stress levels for wt (A) and transgenic plants (B) occurring within 1.5 h after rewatering. Black and white symbols represent the predicted values of PLC for severely and moderately stressed plants, respectively, and were calculated based on measured xylem pressure and the parameters of vulnerability curves. Red (wt) and green (transgenic) circles represent plants recovering within 1.5 h from severe water stress, and light-red (wt) and light-green (transgenic) circles show recovery from moderate stress. Dashed lines indicate EC50PLC = 50%. [See online article for color version of this figure.]
Figure 6.
Figure 6.
A, The rate of recovery from wilting in plants exposed to different levels of water stress expressed in degrees per minute change of the angle between stem and line connecting petiole attachment to the stem and leaf blade base. Data were collected from eight videos with transgenic and wt plants in each video. Statistical analysis revealed a significant difference in the slope during the second phase (fast phase) between wt and transgenic plants (wt = 1.029; transgenic = −0.725; Student’s t test; t = −2.317, df = 10, P < 0.05). B, Typical changes in the angle measured during gradually increasing water stress (hours) and during recovery after rewatering (minutes). The dotted line indicates the time of rewatering. C, The temporal dynamic of recovery is composed of two phases: a slow phase and a fast phase. D, Visualization of the angle between stem and the line connecting petiole attachment to the stem and leaf blade base. The angle was measured every 1 h under increasing water stress and every 6 min during recovery. [See online article for color version of this figure.]
Figure 7.
Figure 7.
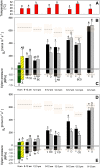
Temporal dynamics of the recovery of gs and xylem pressure in plants recovering from moderate (B and C) and severe (D and E) water stress for wild-type (black bars) and transgenic (gray bars) lines. Measurements were conducted over 4 consecutive d in greenhouse conditions. A provides mean values of greenhouse temperatures. Stressed plants were rewatered the first day of the experiment a few minutes after 9 am, the time when xylem pressure and gs values were measured (netted pattern (green) bars, wild type; cross pattern (yellow) bars, transgenic). Dashed lines show gs and xylem pressure for both wild-type and transgenic well-watered controls plants (there was no difference between wild-type and PIP1 down-regulated controls for both gs and xylem pressure; dashed lines are mean value ± sd (shaded areas]). One-way ANOVA test suggests significant differences between morning and afternoon greenhouse temperatures (P < 0.001), gs (P < 0.001), and xylem pressure (P < 0.001) in plants recovering from moderate and severe stresses. Letters denote homogeneous groups based on the Fisher lsd method (lowercase letters, wild type; uppercase letters, transgenic lines). Bars are mean values, and error bars represent sd. [See online article for color version of this figure.]
Figure 8.
Figure 8.
Total osmotic potential collected from stem xylem sap of plants recovering from moderate (Px < EC50PLC) and severe water stress (Px > EC50PLC). A one-way ANOVA test suggests significant differences between treatments in both wt and transgenic plants (P < 0.001). Letters denote homogeneous groups based on the Fisher lsd method (lowercase letters, wild type; uppercase letters, transgenic lines). Bars are mean values, and error bars represent sd.

Similar articles

Cited by

References

    1. Brennen CE. (1995) Cavitation and Bubble Dynamics, Vol 44 Oxford University Press, Inc., Oxford, United Kingdom
    1. Brodersen CR, McElrone AJ. (2013) Maintenance of xylem network transport capacity: a review of embolism repair in vascular plants. Front Plant Sci 4: 108. - PMC - PubMed
    1. Brodersen CR, McElrone AJ, Choat B, Matthews MA, Shackel KA. (2010) The dynamics of embolism repair in xylem: in vivo visualizations using high-resolution computed tomography. Plant Physiol 154: 1088–1095 - PMC - PubMed
    1. Brodribb TJ, McAdam SAM. (2013) Abscisic acid mediates a divergence in the drought response of two conifers. Plant Physiol 162: 1370–1377 - PMC - PubMed
    1. Carraro N, Tisdale-Orr TE, Clouse RM, Knöller AS, Spicer R. (2012) Diversification and expression of the PIN, AUX/LAX, and ABCB families of putative auxin transporters in populus. Front Plant Sci 3: 17. - PMC - PubMed

Publication types