. 2014 Apr 3;508(7494):93-7.
doi: 10.1038/nature13020. Epub 2014 Feb 23.

Mouse liver repopulation with hepatocytes generated from human fibroblasts

Affiliations

Mouse liver repopulation with hepatocytes generated from human fibroblasts

Saiyong Zhu et al. Nature. .

Abstract

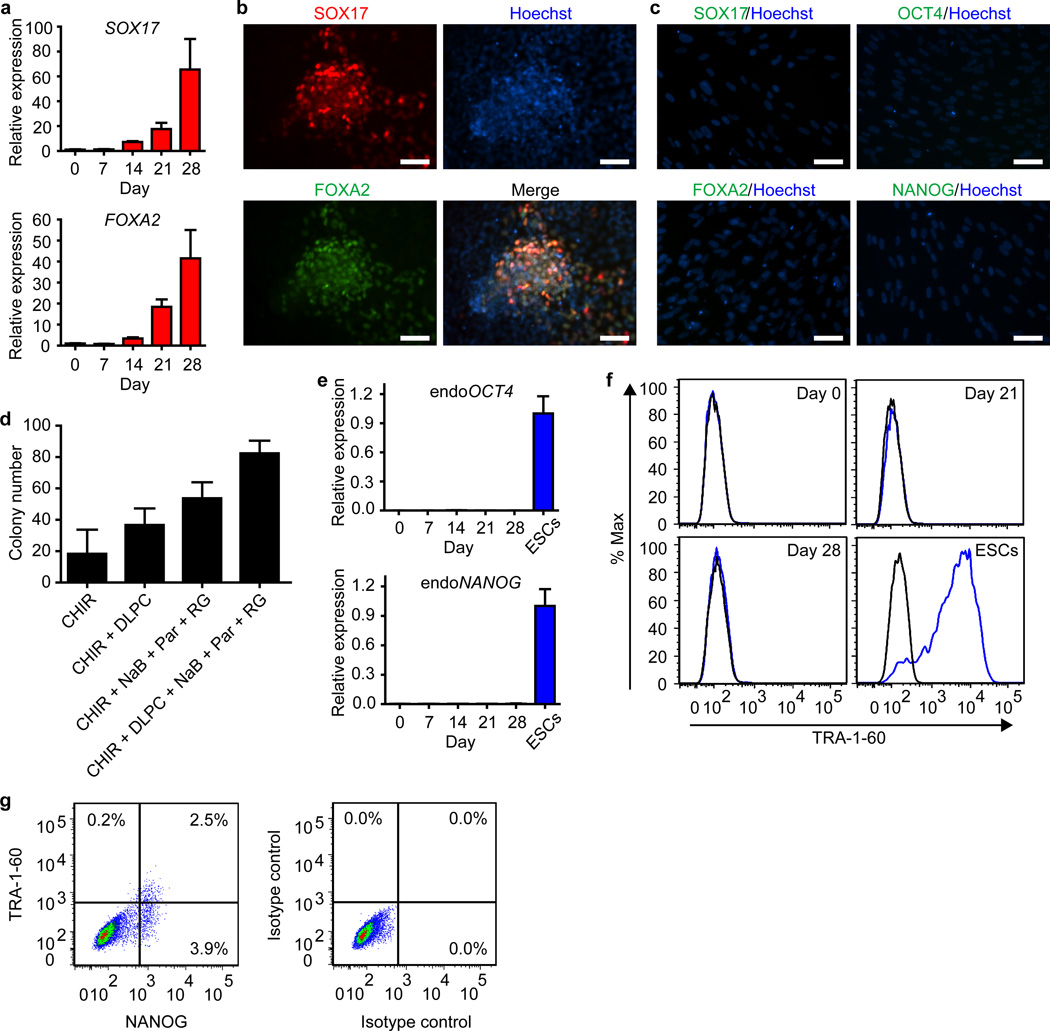
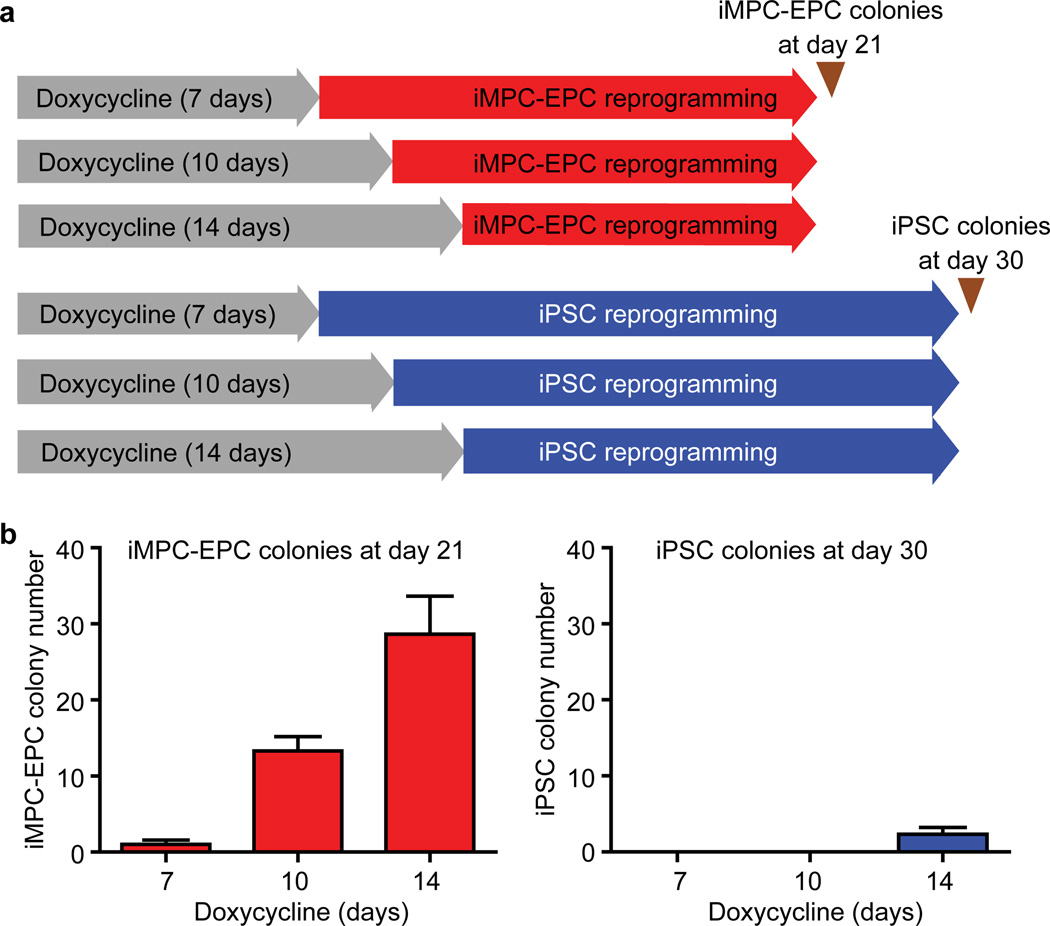
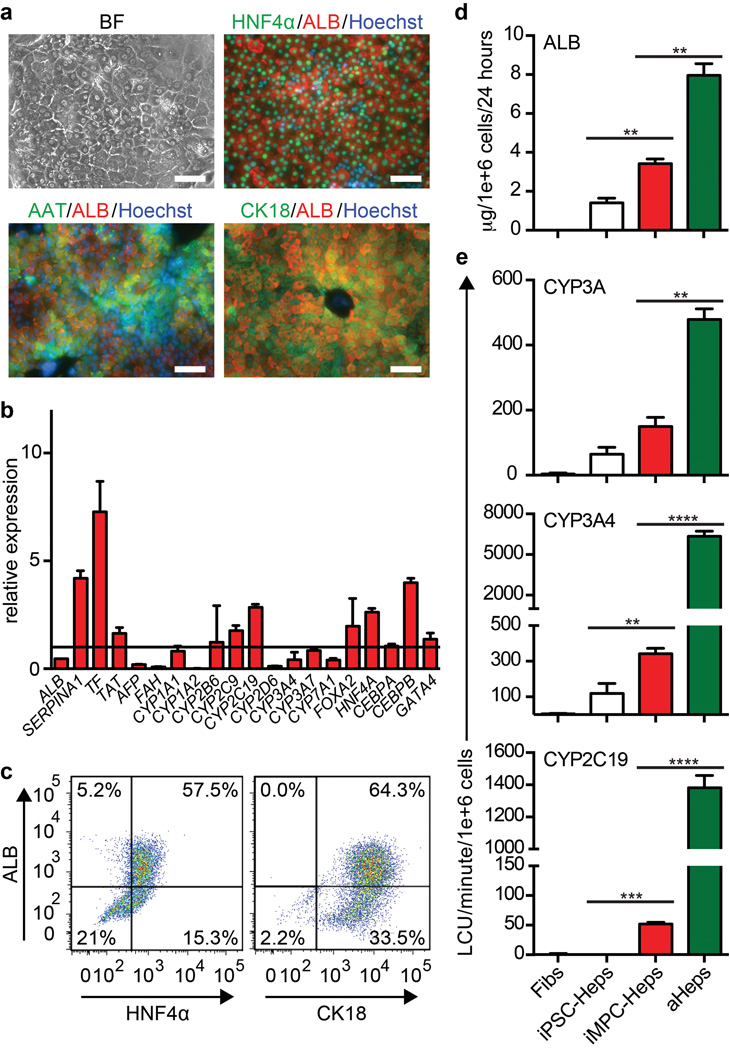
Human induced pluripotent stem cells (iPSCs) have the capability of revolutionizing research and therapy of liver diseases by providing a source of hepatocytes for autologous cell therapy and disease modelling. However, despite progress in advancing the differentiation of iPSCs into hepatocytes (iPSC-Heps) in vitro, cells that replicate the ability of human primary adult hepatocytes (aHeps) to proliferate extensively in vivo have not been reported. This deficiency has hampered efforts to recreate human liver diseases in mice, and has cast doubt on the potential of iPSC-Heps for liver cell therapy. The reason is that extensive post-transplant expansion is needed to establish and sustain a therapeutically effective liver cell mass in patients, a lesson learned from clinical trials of aHep transplantation. Here, as a solution to this problem, we report the generation of human fibroblast-derived hepatocytes that can repopulate mouse livers. Unlike current protocols for deriving hepatocytes from human fibroblasts, ours did not generate iPSCs but cut short reprogramming to pluripotency to generate an induced multipotent progenitor cell (iMPC) state from which endoderm progenitor cells and subsequently hepatocytes (iMPC-Heps) could be efficiently differentiated. For this purpose we identified small molecules that aided endoderm and hepatocyte differentiation without compromising proliferation. After transplantation into an immune-deficient mouse model of human liver failure, iMPC-Heps proliferated extensively and acquired levels of hepatocyte function similar to those of aHeps. Unfractionated iMPC-Heps did not form tumours, most probably because they never entered a pluripotent state. Our results establish the feasibility of significant liver repopulation of mice with human hepatocytes generated in vitro, which removes a long-standing roadblock on the path to autologous liver cell therapy.


Conflict of interest statement

Competing financial interests

The authors declare no competing financial interests.

Figures

Extended Data Figure 1
Extended Data Figure 1. Reprogramming of Fibs into endoderm progenitor cells without activation of pluripotency markers
a, qRT-PCR shows expression levels of the endoderm-specific genes SOX17 and FOXA2 during the reprogramming process (combination of initiation and reprogramming steps of the protocol) relative to starting cells at day 0. Error bars represent SEM of biological replicates (n = 3). b, Immunostainings show co-expression of SOX17 and FOXA2 in colonies at day 28. Scale bars = 100 µm. c, Immunostainings show absence of SOX17 and FOXA2 and the pluripotency-specific markers OCT4 and NANOG in Fibs. Scale bars = 100 µm. d, Small molecules increase the number of colonies positive in FOXA2 immunostaining at day 28. Medium containing Activin A was additionally supplemented with the indicated small molecules. Error bars represent SEM of biological replicates (n = 3). e, qRT-PCR shows absence of endogenous (endo) OCT4 and NANOG gene expression during reprogramming to endoderm. Gene expression levels are shown relative to ESCs. Error bars represent SEM of biological replicates (n = 3). f, Flow cytometry shows absence of cells expressing the pluripotency marker TRA-1-60 at the end of the reprogramming process. Cells at day 0 and ESCs were used as controls. At least 10,000 events were collected. g, Flow cytometry for TRA-1-60 and NANOG of 10,000 cells from a culture of Fibs transduced with retroviruses expressing OCT4, SOX2, and KLF4 and grown under iPSC reprogramming conditions for 30 days shows that both markers are effective in delineating rare cells reprogrammed to pluripotency. Because the number of NANOG-positive cells is higher than the number of TRA-1-60-positive cells, and virtually all TRA-1-60-positive cells are NANOG positive, NANOG appears to be a more sensitive marker in this process.
Extended Data Figure 2
Extended Data Figure 2. Analysis of FOXA2 and NANOG expression at the colony and single-cell level during Fib-to-iMPC-EPC reprogramming
a, Schematic showing time points of analysis. b, Quantification of FOXA2-positive and NANOG-positive colonies forming during the reprogramming process. Error bars represent SEM of biological replicates (n = 3). c, Representative immunostainings show FOXA2-positive colonies emerging at day 16 of the reprogramming process and absence of NANOG-positive colonies or cells at all time points. Scale bars = 100 µm. d, Flow cytometry shows a gradual increase in the number of FOXA2-positive cells beginning at day 16 of the reprogramming process, whereas NANOG-positive cells are absent at all time points. Fibs, ESCs, and iMPC-EPCs were used as controls. At least 10,000 events were collected.
Extended Data Figure 3
Extended Data Figure 3. Reprogramming of Fibs into iMPC-EPCs occurs earlier and is more efficient than reprogramming into iPSCs
a, Schematic showing duration of Dox treatment and time allowed for reprogramming to occur until analysis. b, Quantification of iMPC-EPC and iPSC colonies forming from Fibs cultured under iMPC-EPC and iPSC reprogramming conditions, respectively, in response to different durations of Dox treatment. iMPC-EPC and iPSC colonies were identified by FOXA2 and NANOG immunostaining, respectively. Error bars represent SEM of biological replicates (n = 3).
Extended Data Figure 4
Extended Data Figure 4. Expansion and further characterization of iMPC-EPCs
a, Medium containing both CHIR and A83 promotes iMPC-EPC colony expansion. Scale bars = 100 µm. b, Supplementing medium containing both CHIR and A83 with EGF and bFGF further increases the number of iMPC-EPC colonies forming after passaging. Error bars represent SEM of biological replicates (n = 3). c, Immunostainings show that expanded (passage 7) iMPC-EPCs remain positive for FOXA2 and negative for NANOG. ESCs were used as controls. Scale bars = 100 µm. d, Immunostainings show HNF4α expression in an iMPC-EPC colony after expansion (passage 4), but not at day 21 of the reprogramming process, indicating that expansion induces HNF4α expression. Scale bars = 100 µm. e, Immunostaining shows that iMPC-EPCs acquire expression of the hepatic differentiation marker AFP after exposure to bFGF and BMP4 for 4 days. f, Immunostaining shows that iMPC-EPCs acquire expression of the pancreatic differentiation marker PDX1 after exposure to retinoic acid, GDC-0449 (Sonic Hedgehog inhibitor), and LDN-193189 (BMP inhibitor) for 4 days. Scale bars = 100 µm.
Extended Data Figure 5
Extended Data Figure 5. Directed differentiation of iMPC-EPCs into iMPC-Heps
a, Immunostainings show that almost all iMPC-EPCs express AFP after sequential exposure to bFGF, BMP4, Dex, HGF, and OSM, whereas only a subset of the cells acquires ALB and AAT expression. Scale bars = 100 µm. b, qRT-PCR at day 18 of the hepatocyte specification step of the protocol shows an additive effect of A83 and C-E in inducing expression of ALB. Gene expression levels are shown relative to iMPC-EPCs treated with carrier DMSO. Error bars represent SEM of technical replicates (n = 3).
Extended Data Figure 6
Extended Data Figure 6. Analysis of hepatocyte function of iMPC-Heps in vitro
a, Periodic acid-Schiff (PAS) staining shows that iMPC-Heps contain glycogen. Adding Dil-ac-low-density lipoprotein (LDL) fluorescent substrate to the culture medium shows that iMPC-Heps take up LDL. Incubation with BODIPY 493/503 or staining with Oil-red-O (ORO) shows storage of lipids in iMPC-Heps. Fibs were used as negative controls. Scale bars = 100 µm. b, iMPC-Heps produce urea. The concentrations of urea measured in cell culture medium at the indicated time points are shown relative to the concentrations of urea measured in fresh medium. Fibs were used as negative control. Error bars represent SEM of biological replicates (n = 3). c, qRT-PCR shows higher expression of several hepatocyte-specific genes including ALB and SERPINA1, and lower expression of AFP, a marker of immature hepatocytes, in iMPC-Heps than in iPSC-Heps generated using current standard protocols. Gene expression of many CYP450 enzymes is also higher in iMPC-Heps than in iPSC-Heps, indicating that iMPC-Heps have a more mature hepatocyte phenotype than iPSC-Heps. Gene expression levels in iPSC-Heps were set to 1. Error bars represent SEM of technical replicates (n = 3). d, iMPC-Heps secrete more ALB and have higher CYP3A family, CYP3A4, and CYP2C19 activities than iPSC-Heps generated with the iMPC-EPC/Hep generation protocol, referred to as iPSC-Heps (NP). Results were calculated as the mean of biological replicates (n = 3). Error bars represent analytical SEM, t test, *P < 0.05, **P < 0.01.
Extended Data Figure 7
Extended Data Figure 7. Quantification and isolation of repopulating nodules formed by transplanted iMPC-Heps
a, Immunostainings show a small and a large nodule of iMPC-Heps detected with a human-specific ALB antibody at 3 and 9 months after transplantation. Scale bars = 100 µm. b, Multiple large nodules of iMPC-Heps identified by FAH immunostaining at 9 months after transplantation. Scale bar = 100 µm. c, Size distribution of nodules of iMPC-Heps 9 months after transplantation based on ALB and FAH immunostaining. d, Example of an iMPC-Hep nodule identified by ALB immunostaining for isolation by LCM. Blood vessels (numbers) were used as additional markers of the location of a nodule in an adjacent, unfixed cryosection. e, Confirmation of successful isolation of an iMPC-Hep nodule by ALB immunostaining after LCM. The middle image shows a cryosection fixed and immunostained for ALB after LCM to confirm specific isolation of a nodule. The left and right images show ALB immunostainings of cryosections flanking the cryosection used for LCM. Scale bars = 100 µm.
Extended Data Figure 8
Extended Data Figure 8. Assessment of in vivo maturation of iMPC-Heps by global gene expression profiling
a, Venn diagram showing the number of genes significantly (P < 0.05) differentially expressed between iMPC-Heps and aHeps in vivo. Of 17,367 reliably detected genes, 132 are differentially expressed; 78 genes are expressed higher in iMPC-Heps and 54 genes are expressed higher in aHeps. The complete results of the global gene expression profiling—including the genes that are differentially expressed between aHeps and iMPC-Heps in vivo—are shown in Supplementary Table 2. b-e, Further analysis of results from global gene expression profiling using gene sets of the hepatocyte function-related Gene Ontology (GO) terms REACTOME CYTOCHROME P450 ARRANGED BY SUBSTRATE TYPE (b), BILE ACID METABOLIC PROCESS (c), GLUCOSE METABOLIC PROCESS (d), and RESPONSE TO XENOBIOTIC STIMULUS (e). GO terms and annotated genes were obtained from Molecular Signatures Database (MSigDB) v4.0. Heatmaps were generated individually for each GO term; a representative colour legend is shown. All results are from one microarray analysis.
Extended Data Figure 9
Extended Data Figure 9. Assessment of in vivo maturation of iMPC-Heps by immunostaining
a, Co-immunostaining for ALB and AFP shows lack of expression of the immature hepatocyte-specific marker AFP in iMPC-Hep and aHep nodules. Human fetal liver was used as a positive control. Scale bars = 100 µm. b,c, Co-immunostainings for ALB and CYP3A4 (b) or CYP2D6 (c) show expression of these mature hepatocyte-specific markers in iMPC-Heps. Of note, the CYP450 antibodies detect the mouse homologues of CYP3A4 and CYP2D6, which—as in humans—appear to be expressed in hepatocytes, but not in nonparenchymal liver cells. Scale bars = 100 µm.
Extended Data Figure 10
Extended Data Figure 10. Therapeutic efficacy and safety of iMPC-Heps
a, Kaplan-Meier survival curve shows that 1 × 10⁶ transplanted iMPC-Heps, iPSC/ESC-Heps, or aHeps are not effective in rescuing mice from death from acute liver failure. Log-rank test P = 0.4426 between iMPC-Heps and iPSC/ESC-Heps, P = 0.4031 between iMPC-Heps and aHeps. b, Kaplan-Meier survival curve shows similar efficacy of 1 × 10⁶ transplanted aHeps and iMPC-Heps, but not iPSC/ESC-Heps, in preventing death in mice suffering from chronic liver failure. Log-rank test P < 0.01 between iMPC-Heps and iPSC/ESC-Heps, P = 0.9501 between iMPC-Heps and aHeps. The number of mice in each group is shown in parentheses. c, H&E staining shows a dysplastic nodule in the liver of an FRG mouse transplanted with iMPC-Heps. Scale bar = 100 µm. d, Co-immunostaining with human-specific β2-microglobulin (B2M) and ALB antibodies shows that the cells within dysplastic nodules (dashed line) are negative for both markers and therefore of mouse origin. Scale bars = 100 µm. Nodules of iMPC-Heps or aHeps are shown as controls.
Figure 1
Figure 1. Protocol for stepwise iMPC-Hep generation
Reprogramming of Fibs to endoderm was initiated in medium containing CHIR (GSK3β inhibitor), dilauroyl phosphatidylcholine (DLPC; LRH1 agonist), the epigenetic modifiers sodium butyrate (NaB; HDAC inhibitor), Parnate (Par; LSD1 inhibitor), and RG108 (RG; DNMT inhibitor), and epidermal growth factor (EGF) and basic fibroblast growth factor (bFGF). To promote reprogramming, EGF and bFGF were replaced with Activin A. Individual iMPC-EPC colonies were expanded in medium containing CHIR, EGF, bFGF, and A83 (TGFβ type I receptor inhibitor). For hepatocyte specification, medium containing bFGF, A83, bone morphogenetic protein 4 (BMP4), dexamethasone (Dex), hepatocyte growth factor (HGF), oncostatin M (OSM), and C–E was used.
Figure 2
Figure 2. Characterization of iMPC-EPCs
a, Bright field (BF) microscopy shows morphology of iMPC-EPCs at passage 25; immunostainings show expression of FOXA2, SOX17, and HNF4α. Scale bars = 100 µm. b, Expansion capacity of iMPC-EPCs as compared to Fibs. Cell numbers were counted at indicated time points. Error bars represent SEM of biological replicates (n = 3). c, qRT-PCR of genes specific for endoderm, pluripotency, ectoderm, or mesoderm in iMPC-EPCs as compared to Fibs, ESCs, and ESC-derived DECs or GECs. Gene expression levels are shown relative to Fibs. Error bars represent SEM of technical replicates (n = 3).
Figure 3
Figure 3. Characterization of iMPC-Heps
a, BF microscopy shows morphology of iMPC-Heps; immunostainings show expression of HNF4α, ALB, AAT, and CK18. Scale bars = 100 µm. b, qRT-PCR of hepatocyte marker gene expression in iMPC-Heps relative to fHeps. The immature hepatocyte-specific genes CYP1A1/3A7 and the mature hepatocyte-specific genes CYP2B6/2C9/2C19/3A4, but not CYP1A2/2D6, are expressed at similar levels in iMPC-Heps and fHeps. Error bars represent SEM of technical replicates (n = 3). c, Flow cytometry shows that most iMPC-Heps express ALB, HNF4α, and CK18. d, Enzyme-linked immunosorbent assay (ELISA) shows significant ALB secretion by iMPC-Heps as compared to Fibs, iPSC-Heps, and aHeps. Error bars represent SEM of biological replicates (n = 3), t test, **P < 0.01. e, Quantification of the activities of the CYP3A family (assay selectivity: CYP3A5 ≥ CYP3A5 > CYP3A4), CYP3A4, and CYP2C19 shows higher levels in iMPC-Heps than in iPSC-Heps. Fibs and aHeps were used as negative and positive controls, respectively. Error bars represent SEM of biological replicates (n = 3), t test, **P < 0.01, ***P < 0.001, ****P < 0.0001.
Figure 4
Figure 4. Post-transplant proliferation and maturation of iMPC-Heps
a, HSA levels in recipients of iMPC-Heps or aHeps. Stars indicate time points of analysis. Arrow marks fatality. b, Co-immunostaining for human-specific ALB and Ki67 identifies proliferating iMPC-Heps (arrowheads) in the periphery of a repopulating nodule. Scale bar = 100 µm. c, Heatmap of 1,299 genes differentially expressed between iMPC-Heps, freshly isolated aHeps and iPSC-Heps before (in vitro) and after (in vivo) transplantation. Multiple nodules were pooled to generate a sample. Genes with expression levels below background (log2 normalized expression < 3) and genes not varying over all samples (s.d. expression < 1) were filtered out. Hierarchical clustering was performed with the hclust function in R v.2.15.1. d, qRT–PCR of the samples used for microarray analysis shows mean hepatocyte marker gene expression in iMPC-Heps relative to aHeps in vivo. e, Analysis of human-specific CYP2D6-mediated DB metabolism in iMPC-Hep- or aHep-repopulated mice by liquid chromatography-tandem mass spectrometry (LC-MS/MS). Plasma levels of DB and its metabolite 4-OH-DB peaked 1 hour after gavage. Molar 4-OH-DB/DB ratios at 1 hour are shown, calculated as the mean of the ratios for repeat injections (n = 3). Error bars represent analytical SEM, t test, **P < 0.01. f, Co-immunostaining with human-specific ALB and mouse-specific Alb antibodies shows absence of double-positive cells, which rules out fusion of iMPC-Heps with mouse hepatocytes. Scale bars = 100 µm.

Comment in

References

    1. Si-Tayeb K, et al. Highly efficient generation of human hepatocyte-like cells from induced pluripotent stem cells. Hepatology. 2010;51:297–305. - PMC - PubMed
    1. Rashid ST, et al. Modeling inherited metabolic disorders of the liver using human induced pluripotent stem cells. J Clin Invest. 2010;120:3127–3136. - PMC - PubMed
    1. Ma X, et al. Highly efficient differentiation of functional hepatocytes from human induced pluripotent stem cells. Stem Cells Transl Med. 2013;2:409–419. - PMC - PubMed
    1. Puppi J, et al. Improving the techniques for human hepatocyte transplantation: report from a consensus meeting in London. Cell Transplant. 2012;21:1–10. - PubMed
    1. Liu H, Kim Y, Sharkis S, Marchionni L, Jang YY. In vivo liver regeneration potential of human induced pluripotent stem cells from diverse origins. Sci Transl Med. 2011;3:82ra39. - PMC - PubMed

Publication types

Associated data