. 2014 Mar 6;507(7490):73-7.
doi: 10.1038/nature13074. Epub 2014 Feb 26.

Crystal structure of the plant dual-affinity nitrate transporter NRT1.1

Affiliations

Crystal structure of the plant dual-affinity nitrate transporter NRT1.1

Ji Sun et al. Nature. .

Abstract

Nitrate is a primary nutrient for plant growth, but its levels in soil can fluctuate by several orders of magnitude. Previous studies have identified Arabidopsis NRT1.1 as a dual-affinity nitrate transporter that can take up nitrate over a wide range of concentrations. The mode of action of NRT1.1 is controlled by phosphorylation of a key residue, Thr 101; however, how this post-translational modification switches the transporter between two affinity states remains unclear. Here we report the crystal structure of unphosphorylated NRT1.1, which reveals an unexpected homodimer in the inward-facing conformation. In this low-affinity state, the Thr 101 phosphorylation site is embedded in a pocket immediately adjacent to the dimer interface, linking the phosphorylation status of the transporter to its oligomeric state. Using a cell-based fluorescence resonance energy transfer assay, we show that functional NRT1.1 dimerizes in the cell membrane and that the phosphomimetic mutation of Thr 101 converts the protein into a monophasic high-affinity transporter by structurally decoupling the dimer. Together with analyses of the substrate transport tunnel, our results establish a phosphorylation-controlled dimerization switch that allows NRT1.1 to uptake nitrate with two distinct affinity modes.


Conflict of interest statement

Authors declare no financial interest.

Figures
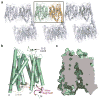
Figure 1
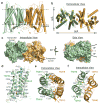
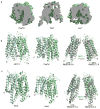
Figure 1. Crystal packing and overall structure of NRT1.1
a, Crystal packing of NRT1.1 in C2221 space group with two molecules in each asymmetric unit. b, Overall structure of NRT1.1. The N-terminal and C-terminal domains, the N-terminal conserved segment, the inter-domain linker and Pro492 are colored in pale green, cyan, magenta, yellow and orange, respectively. A functional important extracellular disulfide bond is indicated. c, Cutaway view showing that NRT1.1 is captured in an inward conformation with nitrate displayed in spheres.
Figure 2
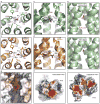
Figure 2. NRT1.1 dimer interface
a, Cylinder representation of the NRT1.1 dimer with Thr101 shown in red sticks. b, Extracellular view of the NRT1.1 dimer with a central 2-fold axis indicated in red. c, Two orthogonal views of the NRT1.1 dimer in surface representation. The dashed line represents the central 2-fold axis. d, NRT1.1 dimer interface. The side chains of all interface residues are shown in cyan spheres. e–f, Extracellular and intercellular views of the NRT1.1 dimer interface with TMH3 and TMH6 shown in ribbon and the side chains of interacting residues shown in sticks. The interface residues of one chain are labeled.
Figure 3
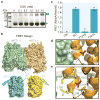
Figure 3. NRT1.1 dimerization controlled by T101 phosphorylation
a, Crosslinking of NRT1.1 with increasing concentrations of EGS. b, The design of FRET assay. Dashed lines indicate the eleven residue long linkers between the fluorescence proteins and the structurally resolved NRT1.1 N-terminus. c, FRET measurements of wild type and mutant NRT1.1. The mCFP-HCN-mYFP-NRT1.1 pair was used as negative control. Consistent with the lose of FRET signal, the T101D mutant failed to be crosslinked in solution (Extended Data Fig. 5b). d, A close-up view of Thr101 at the NRT1.1 dimer interface. e, Thr101-interacting residues with their side chains shown in sticks.
Figure 4
Figure 4. Substrate binding and energy coupling in NRT1.1
a, Intracellular view of the nitrate binding pocket. Nitrate is shown in sticks together with electron density contoured at 4σ from a Fo-Fc map calculated before the nitrate was modeled in. THMs are numbered (orange). E476 is a His356-interacting residue. whose mutation abolishes the transporter function of NRT1.1 (Extended Data Fig. 3b). b, Side view of the putative nitrate binding site and the transporter tunnel with the clustered ExxER motif and K164. c, Nitrate uptake activities of the H356A mutant relative to wild type NRT1.1 in the presence of 10mM or 0.1mM nitrate. All results are the mean ± s.d. of one experiment in quintuplicates or sextuplicates. d, Sequence alignment of eight NRT1 family members from Arabidopsis thaliana in regions surrounding H356 and F511 of NRT1.1.
Figure 5
Figure 5. A dimerization switch model
The non-phosphorylated and structurally coupled NRT1.1 dimer functions as an “in-phase” homodimeric low-affinity nitrate transporter (right). Once phosphorylated, the NRT1.1 dimer is decoupled, and each molecule functions as an independent high-affinity nitrate transporter (left). Different shapes of the putative substrate-binding site at the central transport tunnel reflect its differential nitrate binding properties.
Extended Data Figure 1
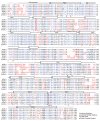
Extended Data Figure 1. Sequence alignment of plant NRT1.1 orthologs
Alignment and secondary structure assignments of NRT1.1 orthologs from Arabidopsis thaliana (At), Brassica napus (Bn), Oryza sativa (Os), Sorghum bicolor (Sb), Populus trichocarpa (Pt), Vitis vinifera (Vv), and Zea mays (Zm). Strictly conserved residues are colored in blue. Green dots indicate the ExxER motif. Orange empty squares indicate dimer interface residues. Red triangles indicate residues in the substrate-binding pocket. Red dot indicates the energy-coupling residue. Dashed lines represent the disordered region in the crystal structure.
Extended Data Figure 2
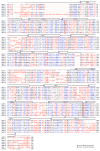
Extended Data Figure 2. Sequence alignment of Arabidopsis NRT1 family members
Alignment and secondary structure assignments of the NRT1 family members from Arabidopsis thaliana. Strictly conserved residues are colored in blue. The two residues potentially important for substrate binding are indicated by red triangle with green stroke. Energy coupling residue is indicated by red dot. Dashed lines represent the disordered region in the crystal structure.
Extended Data Figure 3
Extended Data Figure 3. Nitrate uptake and electron density map of NRT1.1
a, Measurement of nitrate uptake by NRT1.1 was carried out in Xenopus oocytes in the presence of increasing concentrations of nitrate. Q-test was used to identify statistical outliers in data. All data points are mean ± s.d. of one experiment in quintuplicates or sextuplicates. The data were fit with a two site nonlinear binding curve using Prism. b, Relative nitrate uptake activities of NRT1.1 mutants to the wild type protein measured in the Xenopus oocyte-based assay in the presence of 10mM nitrate. All results are the mean ± s.d. of one experiment in quintuplicates or sextuplicates. c, The overall 2Fo-Fc map of the NRT1.1 dimer contoured at 1.5σ. d–e, Two representative helixes and their 2Fo-Fc maps contoured at 1.5σ. f, An island of density from the 2Fo-Fc map contoured at 1.5σ is assigned to the head group of DDM bound between TMH5 and TMH8..
Extended Data Figure 4
Extended Data Figure 4. Structural comparison of NRT1.1 and other MSF transporters
a, Cutaway views of PepTst, GlpT and LacY showing their shared inward conformation as observed for NRT1.1. b, Overall structural comparison of NRT1.1 and PepTst with their N-terminal and C-terminal domains (NTD & CTD) colored in pale green and cyan, respectively. Superposition of their NTDs and CTDs are shown separately. c, Comparisons between NRT1.1 and two bacterial NRT2 family nitrate transporters, NarK and NarU.
Extended Data Figure 5
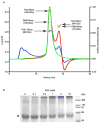
Extended Data Figure 5. Assessment of the oligomerization state of detergent-solubilized NRT1.1
a, SEC-LS-RI-UV analysis of DDM-solubilized NRT1.1. Normalized light scattering signal from the 90° detector, UV absorption signal, and the refractive index signals are plotted in blue, green, and red lines, respectively. The highest peak contains NRT1.1 bound to DDM. The calculated masses of the protein-detergent micelle complex (magenta), DDM micelle (cyan), and the NRT1.1 protein (black) are shown. The complex contains about 196 detergent molecules (MW 510.62) and 1 NRT1.1 molecule (67 kDa). The second peak belongs to the detergent micelle with a mass of 79 kDa or 155 detergent molecules. b, Crosslinking of the NRT1.1 T101D mutant protein with increasing concentrations of EGS. The protein was purified in the presence of 0.1% digitonin.
Extended Data Figure 6
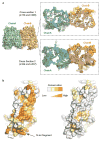
Extended Data Figure 6. Shape complementarity and conservation of the NRT1.1 dimer interface
a, Two representative cross section views of the NRT1.1 dimer interface that are parallel to the membrane. The top cross section goes through the plane defined by Ala110 and Val229 in the two NRT1.1 protomers. The bottom cross section goes through Ala104 and Ala237. b, Conservation surface mapping of NRT1.1 residues at the dimer interface among NRT1.1 orthologs (left) and among Arabidopsis NRT1 family members (right). A color ramp (white, pale yellow, bright orange, to deep orange) is used to indicate the degree of conservation of surface residues. The arrow indicates the N-terminal segment.
Extended Data Figure 7
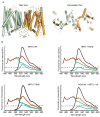
Extended Data Figure 7. Spatial relationship between the N-terminus of the two NRT1.1 protomers
a, The N-termini of the two NRT1.1 protomers in the crystal structure are about 42 Å apart and are shown in two orthogonal orientations. b, Spectral quantification of the FRET. Emission spectra measured from an oocyte expressing WT NRT1.1 (top left), NRT1.1-T101D (top right), NRT1.1-T101A (bottom left), and WT mCitrine-NRT1.1 and mCerulean-HCN2 (bottom right). The spectra are color coded as follows: cyan, 458 nm excitation of oocytes expressing mCerulean constructs alone; black, 488 nm excitation of oocytes expressing both mCitrine and mCerulean constructs; red, 458 nm excitation of oocytes expressing both mCitrine and mCerulean constructs; green, subtracted spectrum (red minus cyan). The dashed line is the position of the peak of the fluorescence signal after excitation at 458nm of the mCitrine-NRT1.1 only expressing oocytes (the position of the Azero or no FRET peak).
Extended Data Figure 8
Extended Data Figure 8. Putative nitrate-binding site in the two NRT1.1 protomers
a–b, Intracellular view of the substrate binding site in the two copies of NRT1.1 within the dimer. To compare the relative position of the substrate to its surrounding residues, distances between the nitrogen atom of the modeled nitrate and select amino acid atoms in its vicinity are shown in dashed lines and indicated. Nitrate is shown in sticks with electron density countered at 4σ from a Fo-Fc map calculated without the substrate. TMHs are numbered. c–d, Side view of the substrate binding site. e–f, A comparison of the putative substrate density between the NRT1.1 structures determined with a cryo-protectant solution containing 10 mM or 0 mM nitrate. g–i, Electrostatic potential surface of the NRT1.1 substrate pocket. The surface colors are clamped between red (−20 kT/e) and blue (+20 kT/e). Nitrate is shown as spheres. Two global views of the electrostatic potential surface of NRT1.1 are shown for comparison.
Extended Data Figure 9
Extended Data Figure 9. The conserved cleft formed by the N-terminal segment of NRT1.1
Overall and close-up views of the N-terminal segments of NRT1.1 within the dimer are shown in surface representation. The cleft forming residues, which are strictly conserved in the NRT1.1 orthologs, are labeled and shown in sticks.

Comment in

Similar articles

Cited by

References

    1. Wang YY, Hsu PK, Tsay YF. Uptake, allocation and signaling of nitrate. Trends in plant science. 2012;17:458–467. doi: 10.1016/j.tplants.2012.04.006. - DOI - PubMed
    1. Tsay YF, Chiu CC, Tsai CB, Ho CH, Hsu PK. Nitrate transporters and peptide transporters. FEBS letters. 2007;581:2290–2300. doi: 10.1016/j.febslet.2007.04.047. - DOI - PubMed
    1. Nacry PB, Gojon EA. Nitrogen acquisition by roots: physiological and developmental mechanisms ensuring plant adaptation to a fluctuating resource. Plant and Soil. 2013;370:29. doi: 10.1007/s11104-013-1645-9. - DOI
    1. Pao SS, Paulsen IT, Saier MH., Jr Major facilitator superfamily. Microbiology and molecular biology reviews: MMBR. 1998;62:1–34. - PMC - PubMed
    1. Law CJ, Maloney PC, Wang DN. Ins and outs of major facilitator superfamily antiporters. Annual review of microbiology. 2008;62:289–305. doi: 10.1146/annurev.micro.61.080706.093329. - DOI - PMC - PubMed

Publication types

MeSH terms

Associated data