Review
. 2014 Oct 1:968:49-63.
doi: 10.1016/j.jchromb.2014.01.026. Epub 2014 Jan 27.

Analysis of biomolecular interactions using affinity microcolumns: a review

Affiliations
Review

Analysis of biomolecular interactions using affinity microcolumns: a review

Xiwei Zheng et al. J Chromatogr B Analyt Technol Biomed Life Sci. .

Abstract

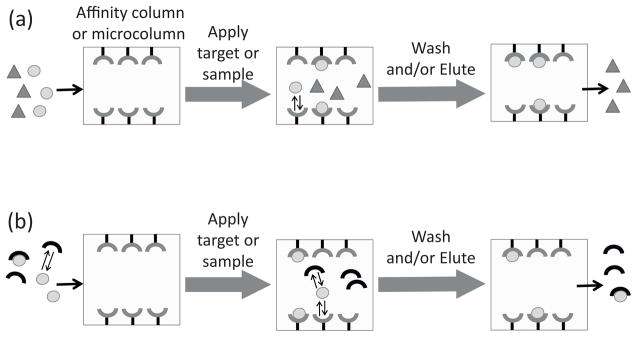
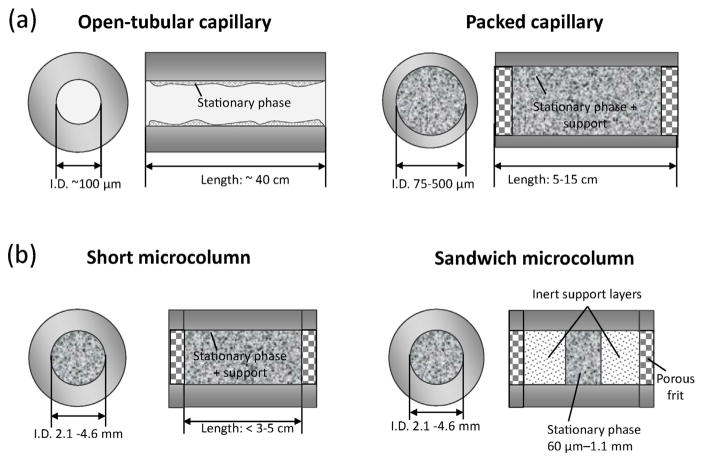
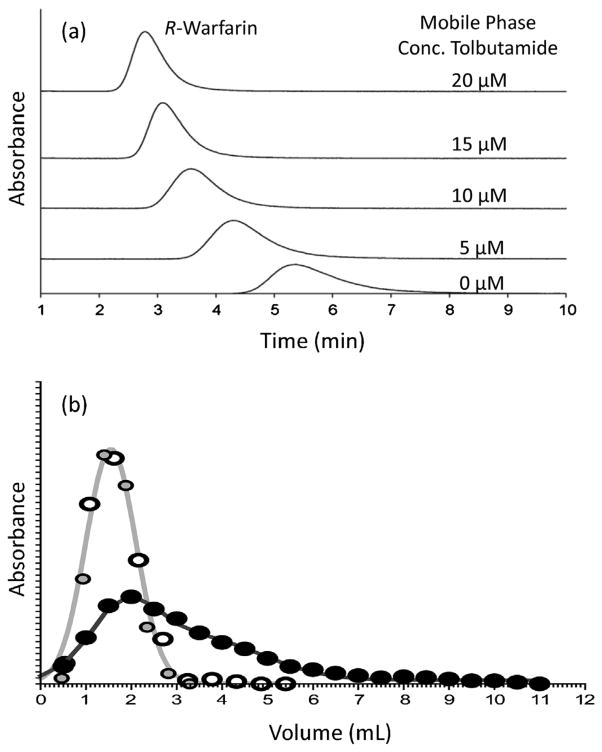
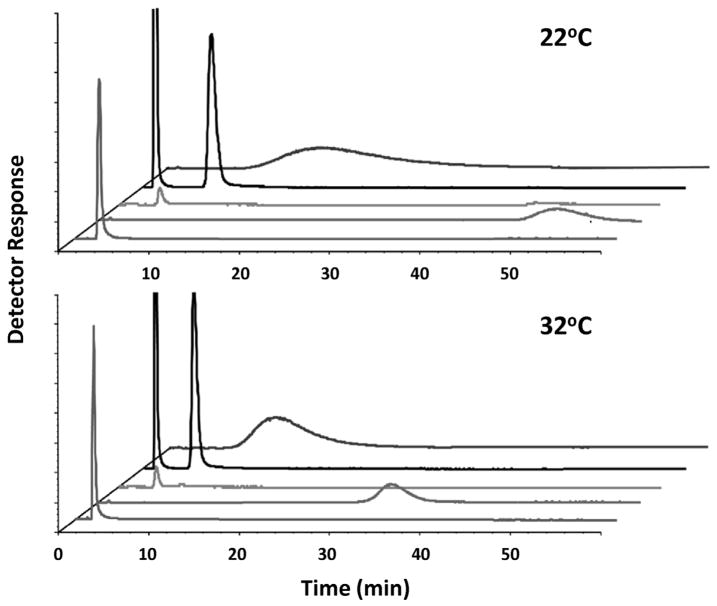
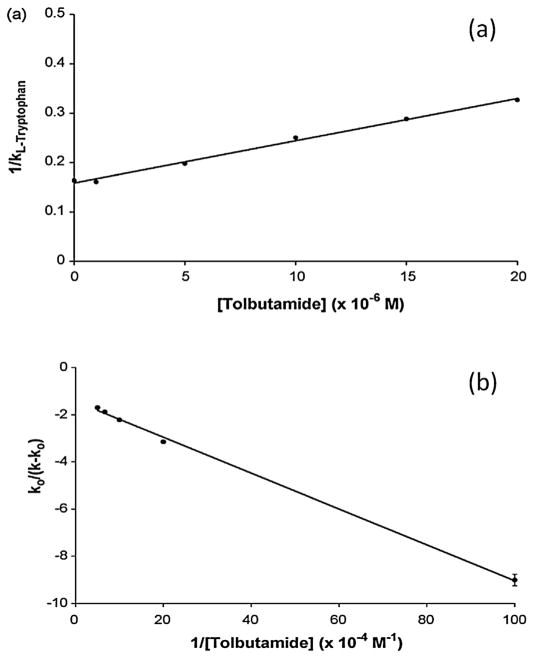
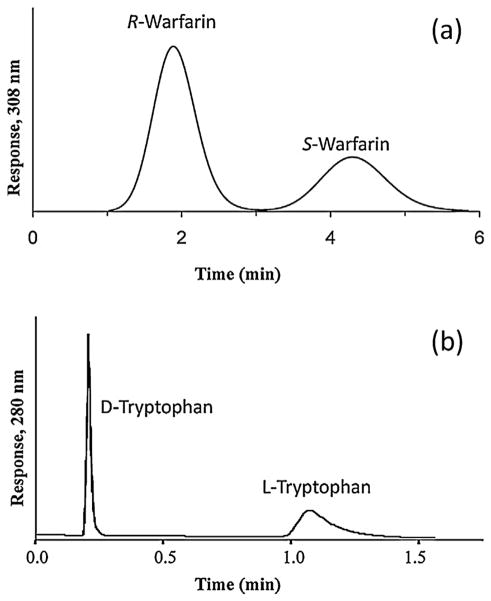
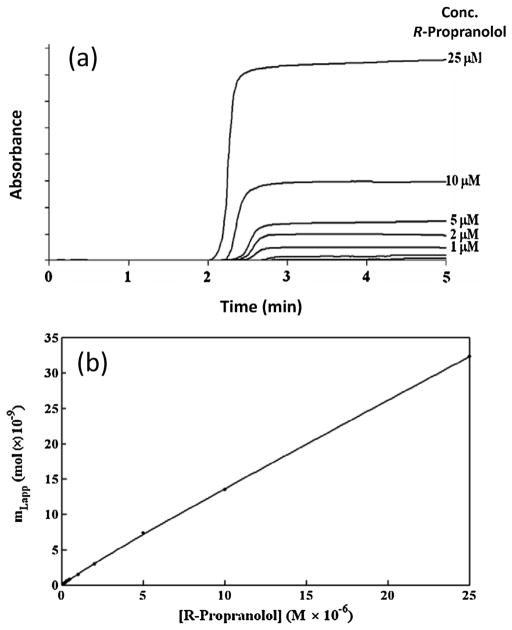
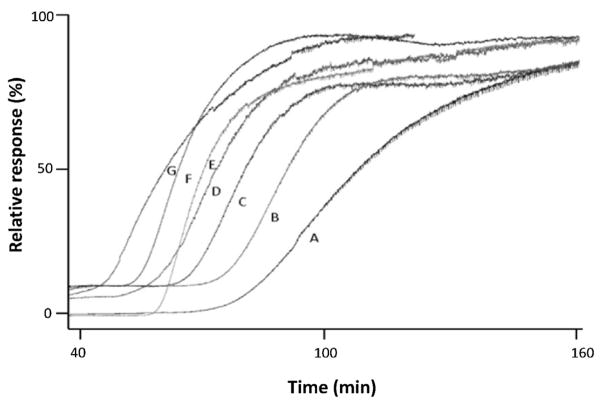
Affinity chromatography has become an important tool for characterizing biomolecular interactions. The use of affinity microcolumns, which contain immobilized binding agents and have volumes in the mid-to-low microliter range, has received particular attention in recent years. Potential advantages of affinity microcolumns include the many analysis and detection formats that can be used with these columns, as well as the need for only small amounts of supports and immobilized binding agents. This review examines how affinity microcolumns have been used to examine biomolecular interactions. Both capillary-based microcolumns and short microcolumns are considered. The use of affinity microcolumns with zonal elution and frontal analysis methods are discussed. The techniques of peak decay analysis, ultrafast affinity extraction, split-peak analysis, and band-broadening studies are also explored. The principles of these methods are examined and various applications are provided to illustrate the use of these methods with affinity microcolumns. It is shown how these techniques can be utilized to provide information on the binding strength and kinetics of an interaction, as well as on the number and types of binding sites. It is further demonstrated how information on competition or displacement effects can be obtained by these methods.

Keywords: Affinity microcolumns; Biointeraction analysis; Frontal affinity chromatography; High-performance affinity chromatography; Ultrafast affinity extraction; Zonal elution.


Figures

Fig. 1
Fig. 1
Two general schemes for the use of HPAC and affinity chromatography to study biomolecular interactions based on (a) the binding of an applied target with the immobilized affinity ligand or (b) use of the affinity ligand to examine interactions of the target with another binding agent in solution.
Fig. 2
Fig. 2
Examples of affinity microcolumns that have been used for studying biomolecular interactions, including designs based on (a) open-tubular or packed capillaries and (b) short microcolumns or sandwich microcolumns.
Fig. 3
Fig. 3
Examples of the use of zonal elution with affinity microcolumns in examining biomolecular interactions. In (a) competition studies based on zonal elution were carried out using the injection of R-warfarin as a site-specific probe onto a microcolumn containing immobilized human serum albumin (HSA) in the presence of various concentrations of tolbutamide in the mobile phase. The results in (b) show the elution profiles for retinoic acid receptor γ (RARγ) that was applied to columns containing apo-cellular retinoic acid binding protein II (CRABP II) (open circles) or holo-CRABP II (black circles) and in the presence of retinoic acid; the gray-shaded circles represent an elution profile of carbonic anhydrase II (CA II) applied to an apo-CRABP II column. Adapted with permission from Refs. [110,112].
Fig. 4
Fig. 4
Use of zonal elution and mass spectrometry with a 0.5 mm i.d. × 10 cm packed capillary containing the N-terminal domain of the protein HSP90 to compare the relative retention of four drug fragments (four upper chromatograms in each plot), using adenosine (bottom chromatogram in each plot) as a reference. Adapted with permission from Ref. [50].
Fig. 5
Fig. 5
Results of zonal elution competition studies on HSA microcolumns examining the change in retention of (a) L-tryptophan as a probe for Sudlow site II and (b) R-warfarin as a probe for Sudlow site I in the presence of tolbutamide as a competing agent. The solid lines show the best-fit responses that were obtained when fitting (a) Eq. (4) or (b) Eq. (5) to the data. These results were obtained under similar or identical conditions to those used in Fig. 3(a). Reproduced with permission from Ref. [110].
Fig. 6
Fig. 6
Chiral separations for (a) R- and S-warfarin and (b) D- and L-tryptophan on a 4.6 mm i.d. × 10 mm microcolumn containing HSA immobilized to a monolith based on a co-polymer of glycidyl methacrylate and ethylene glycol dimethacrylate. The mobile phase was pH 7.4, 0.067 M phosphate buffer that contained 0.5% 1-propanol and the flow rate was (a) 2.0 mL/min or (b) 3.0 mL/min. Reproduced with permission from Ref. [100].
Fig. 7
Fig. 7
(a) Typical chromatograms (i.e., breakthrough curves) obtained for a frontal analysis experiment, as obtained here for the application of various solutions R-propranolol to a 5 cm × 2.1 mm i.d. column containing immobilized high-density lipoprotein (HDL). (b) Analysis of frontal analysis data obtained for R-propranolol on the HDL column by fitting to the results to a model based on a combination of a saturable binding site and a non-saturable interaction. Reproduced with permission from Ref. [117].
Fig. 8
Fig. 8
Example of a displacement experiment using frontal analysis and detection based on mass spectrometry. These chromatograms show the effects of adding (B) vitexin, (C) naringenin, (D) apigenin, (E) quercetin, (F) kaempferol, or (G) luteolin to a solution containing (A) quercetin as the target and applied to a 30 cm × 100 μm i.d. open-tubular capillary column containing an immobilized form of the histone decarboxylase SIRT6. Adapted with permission from Ref. [37].
Fig. 9
Fig. 9
Typical results for a peak decay experiment, as obtained for the injection of nortriptyline at flow rates of 5, 7 or 9 mL/min (from right-to-left) on a 1 mm × 4.6 mm i.d. microcolumn containing immobilized AGP. This example includes the (a) elution profiles and (b) natural logarithm of these elution profiles for a 100 μL injection of 20 μM nortriptyline. Reproduced with permission Ref. [180].
Fig. 10
Fig. 10
General scheme for the use of ultrafast affinity extraction with an HSA microcolumn to separate the free and protein-bound fractions of a drug or solute in an injected sample. Reproduced with permission from Ref. [38].
Fig. 11
Fig. 11
Analysis of split-peak data according to Eq. (12) for injections of rabbit immunoglobulin G (IgG) onto protein A columns prepared by various immobilization methods and supports. The conditions for each plot were as follows: Schiff base method, 500 Å pore size silica, 22 μg IgG (●); Schiff base method, 500 Å pore size support, 11 μg IgG (●); Schiff base method, 50 Å pore size support, 15 μg IgG (▲); carbonyldiimidazole method, 500 Å pore size support, 2.7 μg IgG (■); and ester/amide method, 500 Å pore size support, 8.2 μg IgG (◆). Reproduced with permission from Ref. [97].
Fig. 12
Fig. 12
(a) Chromatograms obtained at several flow rates and (b) analysis of the resulting band-broadening data according to Eq. (13) for studies of the dissociation rate of carbamazepine from a 5 cm × 4.6 mm i.d. HSA column by the peak profiling method. Reproduced with permission from Ref. [194].

References

    1. Schiel JE, Mallik R, Soman S, Joseph KS, Hage DS. J Sep Sci. 2006;29:719–737. - PubMed
    1. Chaiken IM. Analytical Affinity Chromatography. CRC Press; Boca Raton: 1987.
    1. Hage DS. In: Handbook of HPLC. Corradini D, Katz E, Eksteen R, Shoenmakers P, Miller N, editors. Vol. 4. Marcel Dekker; New York: 1998. pp. 483–498.
    1. Mallik R, Hage DS. J Sep Sci. 2006;29:1686–1704. - PubMed
    1. Kwong TC. Clin Chim Acta. 1985;151:193–216. - PubMed

Publication types

LinkOut - more resources