

Characterizing the genetic basis of methylome diversity in histologically normal human lung tissue
- PMID: 24572595
- PMCID: PMC3982882
- DOI: 10.1038/ncomms4365
Characterizing the genetic basis of methylome diversity in histologically normal human lung tissue
Abstract
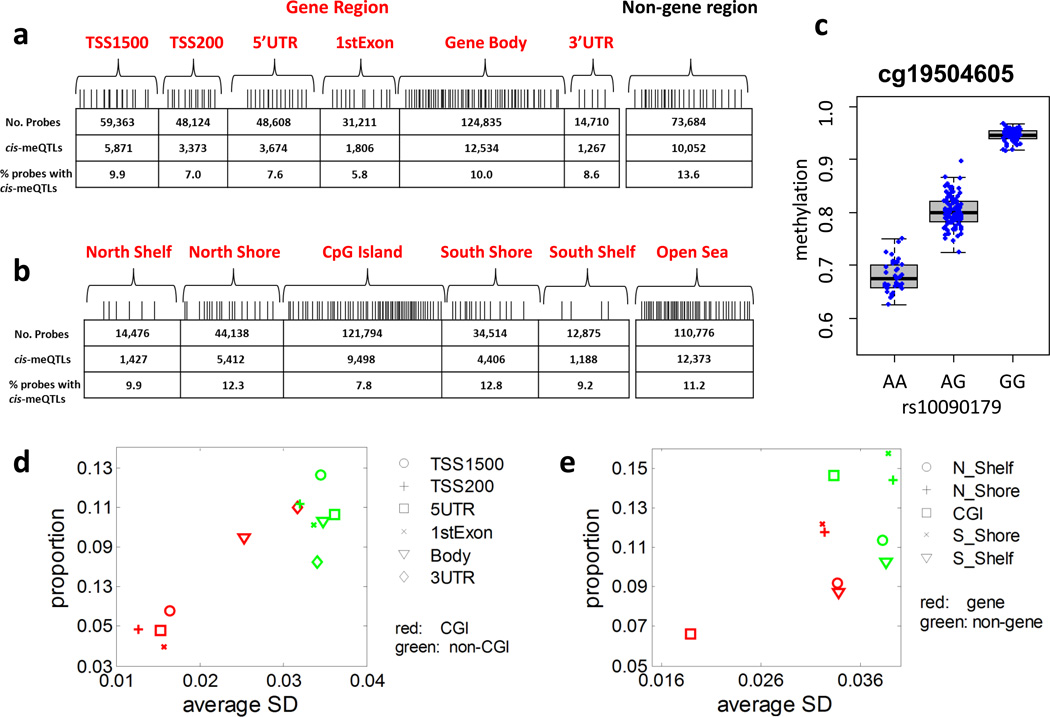
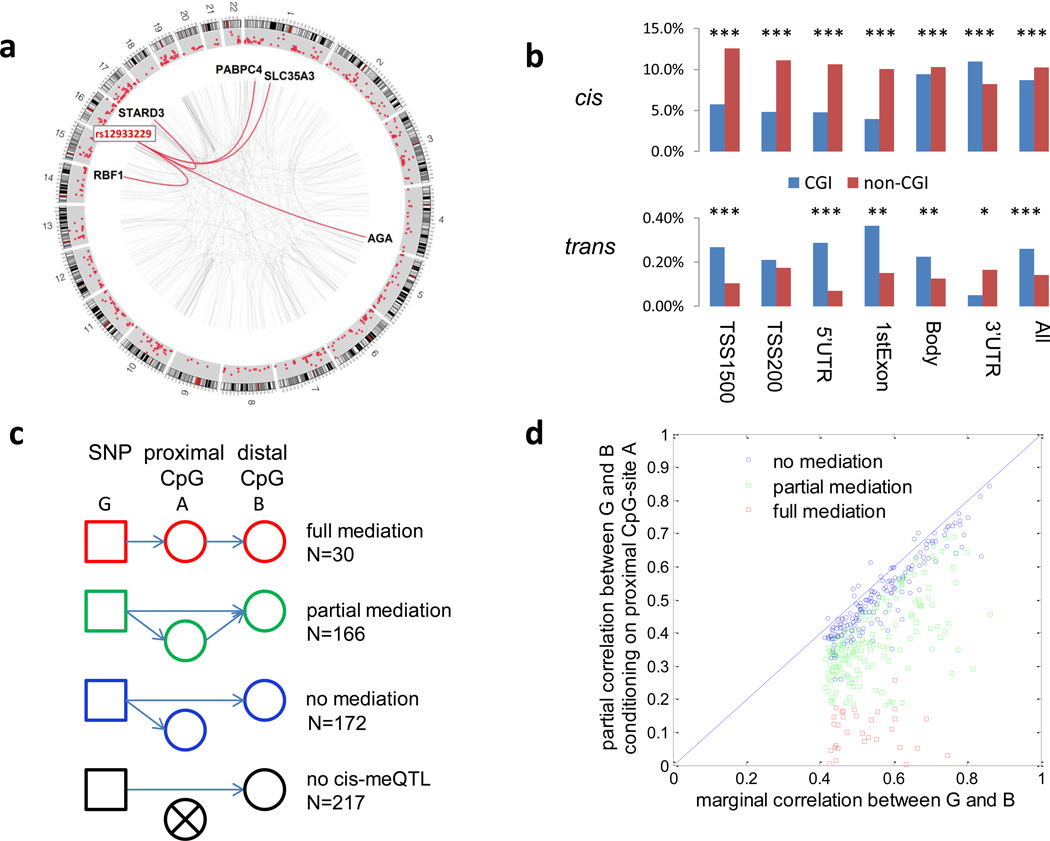
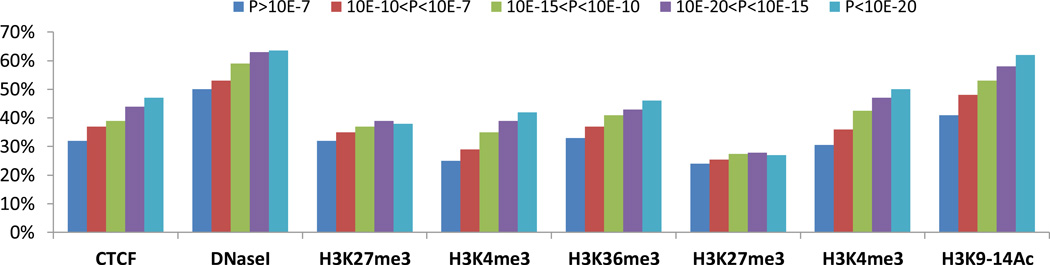
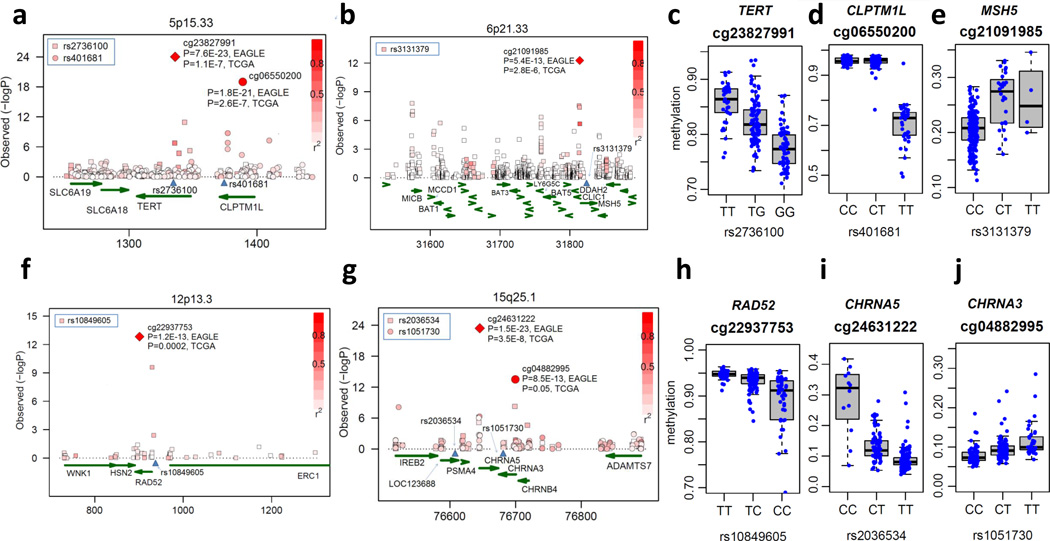
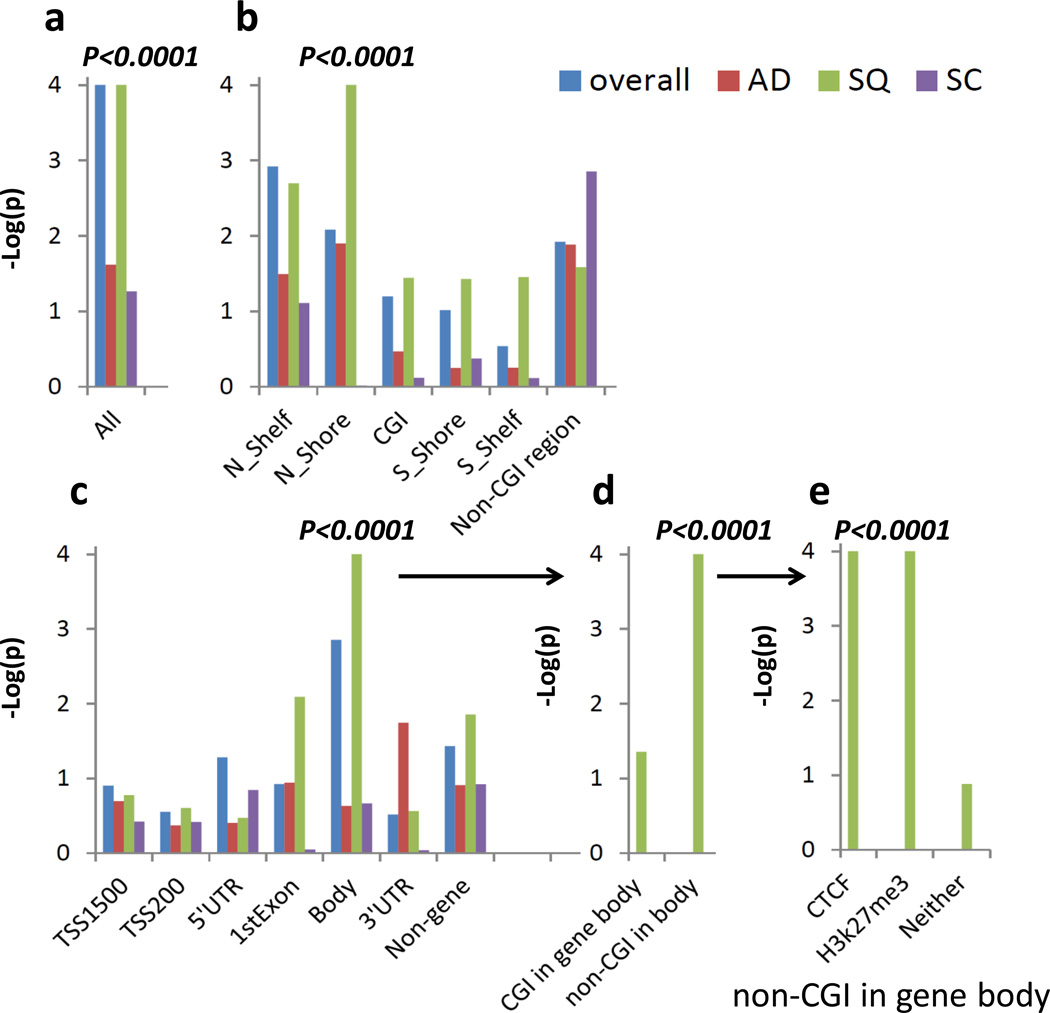
The genetic regulation of the human epigenome is not fully appreciated. Here we describe the effects of genetic variants on the DNA methylome in human lung based on methylation-quantitative trait loci (meQTL) analyses. We report 34,304 cis- and 585 trans-meQTLs, a genetic-epigenetic interaction of surprising magnitude, including a regulatory hotspot. These findings are replicated in both breast and kidney tissues and show distinct patterns: cis-meQTLs mostly localize to CpG sites outside of genes, promoters and CpG islands (CGIs), while trans-meQTLs are over-represented in promoter CGIs. meQTL SNPs are enriched in CTCF-binding sites, DNaseI hypersensitivity regions and histone marks. Importantly, four of the five established lung cancer risk loci in European ancestry are cis-meQTLs and, in aggregate, cis-meQTLs are enriched for lung cancer risk in a genome-wide analysis of 11,587 subjects. Thus, inherited genetic variation may affect lung carcinogenesis by regulating the human methylome.
Figures
Similar articles
-
High density methylation QTL analysis in human blood via next-generation sequencing of the methylated genomic DNA fraction.Genome Biol. 2015 Dec 23;16:291. doi: 10.1186/s13059-015-0842-7. Genome Biol. 2015. PMID: 26699738 Free PMC article.
-
Pancan-meQTL: a database to systematically evaluate the effects of genetic variants on methylation in human cancer.Nucleic Acids Res. 2019 Jan 8;47(D1):D1066-D1072. doi: 10.1093/nar/gky814. Nucleic Acids Res. 2019. PMID: 30203047 Free PMC article.
-
Characterization of cross-tissue genetic-epigenetic effects and their patterns in schizophrenia.Genome Med. 2018 Feb 26;10(1):13. doi: 10.1186/s13073-018-0519-4. Genome Med. 2018. PMID: 29482655 Free PMC article.
-
Genetic impacts on DNA methylation: research findings and future perspectives.Genome Biol. 2021 Apr 30;22(1):127. doi: 10.1186/s13059-021-02347-6. Genome Biol. 2021. PMID: 33931130 Free PMC article. Review.
-
Genetic-epigenetic interactions in cis: a major focus in the post-GWAS era.Genome Biol. 2017 Jun 19;18(1):120. doi: 10.1186/s13059-017-1250-y. Genome Biol. 2017. PMID: 28629478 Free PMC article. Review.
Cited by
-
Hard wiring of normal tissue-specific chromosome-wide gene expression levels is an additional factor driving cancer type-specific aneuploidies.Genome Med. 2021 May 25;13(1):93. doi: 10.1186/s13073-021-00905-y. Genome Med. 2021. PMID: 34034815 Free PMC article.
-
Implication of a Chromosome 15q15.2 Locus in Regulating UBR1 and Predisposing Smokers to MGMT Methylation in Lung.Cancer Res. 2015 Aug 1;75(15):3108-17. doi: 10.1158/0008-5472.CAN-15-0243. Epub 2015 Jul 16. Cancer Res. 2015. PMID: 26183928 Free PMC article.
-
High density methylation QTL analysis in human blood via next-generation sequencing of the methylated genomic DNA fraction.Genome Biol. 2015 Dec 23;16:291. doi: 10.1186/s13059-015-0842-7. Genome Biol. 2015. PMID: 26699738 Free PMC article.
-
The pharmacoepigenomics informatics pipeline defines a pathway of novel and known warfarin pharmacogenomics variants.Pharmacogenomics. 2018 Apr;19(5):413-434. doi: 10.2217/pgs-2017-0186. Epub 2018 Feb 5. Pharmacogenomics. 2018. PMID: 29400612 Free PMC article.
-
HAPRAP: a haplotype-based iterative method for statistical fine mapping using GWAS summary statistics.Bioinformatics. 2017 Jan 1;33(1):79-86. doi: 10.1093/bioinformatics/btw565. Epub 2016 Sep 1. Bioinformatics. 2017. PMID: 27591082 Free PMC article.
References
-
- Kaminsky ZA, et al. DNA methylation profiles in monozygotic and dizygotic twins. Nat Genet. 2009;41:240–245. - PubMed
-
- Heijmans BT, Kremer D, Tobi EW, Boomsma DI, Slagboom PE. Heritable rather than age-related environmental and stochastic factors dominate variation in DNA methylation of the human IGF2/H19 locus. Hum Mol Genet. 2007;16:547–554. - PubMed
Publication types
MeSH terms
Associated data
Grants and funding
- 1 P30 H101258/PHS HHS/United States
- R37HL062569-13/HL/NHLBI NIH HHS/United States
- R21 MH102685/MH/NIMH NIH HHS/United States
- P30CA014089/CA/NCI NIH HHS/United States
- R01 HL114094/HL/NHLBI NIH HHS/United States
- 1 R01 HL114094/HL/NHLBI NIH HHS/United States
- HSN261200800001E/PHS HHS/United States
- U19CA148127/CA/NCI NIH HHS/United States
- R37 HL062569/HL/NHLBI NIH HHS/United States
- U19 CA148127/CA/NCI NIH HHS/United States
- ZIA CP010200/ImNIH/Intramural NIH HHS/United States
- P30 CA014089/CA/NCI NIH HHS/United States
- N02 CP001006/CP/NCI NIH HHS/United States
LinkOut - more resources
Full Text Sources
Other Literature Sources
Molecular Biology Databases
