. 2014 Apr;20(4):505-15.
doi: 10.1261/rna.042259.113. Epub 2014 Feb 26.

Splicing factor hnRNP A2 activates the Ras-MAPK-ERK pathway by controlling A-Raf splicing in hepatocellular carcinoma development

Splicing factor hnRNP A2 activates the Ras-MAPK-ERK pathway by controlling A-Raf splicing in hepatocellular carcinoma development

Asaf Shilo et al. RNA. 2014 Apr.

Abstract

In recent years, it has become clear that splicing factors play a direct role in cancer development. We showed previously that splicing factors SRSF1, SRSF6, and hnRNP A2/B1 are up-regulated in several cancers and can act as oncogenes when up-regulated. Here we examined the role of splicing factors hnRNP A1/A1b and hnRNP A2/B1 in hepatocellular carcinoma (HCC). We show that the splicing factors hnRNP A1 and hnRNP A2 are up-regulated in HCC tumors derived from inflammation-induced liver cancer mouse model. Overexpression of hnRNP A1 or hnRNP A2, but not the splicing isoform hnRNP B1, induced tumor formation of immortalized liver progenitor cells, while knockdown of these proteins inhibited anchorage-independent growth and tumor growth of human liver cancer cell lines. In addition, we found that cells overexpressing hnRNP A2 showed constitutive activation of the Ras-MAPK-ERK pathway. In contrast, knockdown of hnRNP A2 inhibited the Ras-MAPK-ERK pathway and prevented ERK1/2 activation by EGF. Moreover, we found that hnRNP A2 regulates the splicing of A-Raf, reducing the production of a short dominant-negative isoform of A-Raf and elevating the full-length A-Raf transcript. Taken together, our data suggest that hnRNP A2 up-regulation in HCC induces an alternative splicing switch that down-regulates a dominant-negative isoform of A-Raf, leading to activation of the Raf-MEK-ERK pathway and cellular transformation.

Keywords: A-Raf; MAPK; RNA processing; alternative splicing; hnRNP A2/B1; liver cancer.


Figures
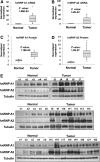
FIGURE 1.
FIGURE 1.
Elevated hnRNP A2 and hnRNP A1 expression in mouse liver tumors. (A,B) Box plot representation of qRT-PCR analysis of hnRNP A1 (A) and hnRNP A2 (B) RNA levels in Mdr2−/− mouse liver tumors (n = 22) and normal mouse liver tissue (n = 5). All samples were normalized to GAPDH mRNA levels, and the average expression in normal liver tissue was arbitrarily set at one. Medians are represented by solid black lines. Top and bottom box edges represent the third and first quartile. Whiskers indicate 90 and 10 percentile; asterisks, minimum and maximum points. (C,D) Box plot representation of protein levels for hnRNP A1 (C) and hnRNP A2 (D) in Mdr2−/− mouse liver tumors and normal liver tissue. All samples were normalized to tubulin protein levels and to the average expression in normal liver tissue, which was arbitrarily set at one. Medians are represented by solid black lines. Top and bottom box edges represent the third and first quartile. Whiskers indicate 90 and 10 percentile; asterisks, minimum and maximum points. (E) Western blot analysis of hnRNP A1 and hnRNP A2 protein levels in Mdr2−/− liver tumors (t) and normal (n) mouse liver tissue. Tubulin was used as loading control. Numbers indicate sample number.
FIGURE 2.
FIGURE 2.
hnRNP A1/A1b and A2, but not B1, can transform PHM-1 cells in vivo. (A,B) PHM-1 cells transduced with retroviruses encoding empty vector (pBABE) or hnRNP A1, A1b, A2, and B1 were analyzed by Western blotting for hnRNP A1/A1b, hnRNP A2/B1, and T7-Tag protein to detect both endogenous and exogenous expression. β-Actin was used as a loading control. (C) Growth curves of cells described in A were measured by methylene blue staining. Error bars, SD (n = 6). (D) Cells described in A were injected (3 × 10⁶ cells/site) subcutaneously near both rear flanks of nude/nude mice, and tumor volume was measured twice weekly (mean ± SEM; n = 16 or 8). (*) P < 0.05, (**) P < 0.001 (two-tailed t-test). (E) Representative mice described in D are shown.
FIGURE 3.
FIGURE 3.
hnRNP A2/B1 and hnRNP A1/A1b are required for HCC transformation. (A) HuH7 cells were transduced with retroviruses encoding shRNAs against hnRNP A1/A1b, hnRNP A2/B1, or empty vector without the shRNA (MLP). Cells were analyzed by Western blotting for hnRNP A1/A1b and hnRNP A2/B1 protein expression. β-Actin was used as a loading control. (B) Cells described in A were seeded into soft agar in duplicate, and colonies were grown for 14 d. Colonies in 10 fields of each well were counted (mean ± SEM; n = 2). (C) Representative fields of colonies in soft agar described in B. (D) Cells described in A were starved (0.1% serum), and survival of cells was measured by methylene blue staining (mean ± SEM; n = 6). (*) P < 0.05, (**) P < 0.001 (two-tailed t-test). (E) Cells described in A were injected (2 × 10⁶ cells/site) subcutaneously near both rear flanks of SCID mice, and a graph depicting tumor growth 29 d after injection is shown. The number of tumors formed per number of injections is shown in parentheses (mean ± SEM; n = 8). (*) P < 0.05 (one-tailed t-test).
FIGURE 4.
FIGURE 4.
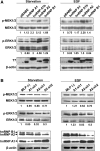
hnRNP A2 activates the Ras-MAPK-ERK pathway. (A,B) PHM-1 (A) and HuH7 (B) cells transduced with the indicated retroviruses were seeded in six-well plates (1 × 10⁵ cells/well for PHM-1 cells, 2 × 10⁵ cells/well for HuH7 cells). Cells were serum-starved for 24 h (0.1% FCS) and stimulated with EGF (10 nM) for 30 min. Cells were lysed and immunoblotted for expression of phosphorylated and total MEK1/2, ERK1/2 and T7-Tag (A) or hnRNP A2/B1 and hnRNP A1/A1b (B). β-Actin was used as a loading control. Fold increase of ERK1/2 or MEK1/2 was normalized (phosphorylated/total protein levels) to that of untreated empty vector, which was arbitrarily set at one. Shown here is one representative experiment out of three repeats (see also Supplemental Fig. S4).
FIGURE 5.
FIGURE 5.
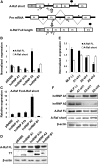
hnRNP A2/B1 regulates A-Raf alternative splicing. (A) A diagram showing intronic and exonic regions of A-Raf regulated by alternative splicing generating the dominant-negative A-Raf short isoform or the FL transcript. Black lines represent introns, empty boxes represent coding exons, gray boxes represent 5′ UTR, and black circles represent stop codons. Arrows represent primer positions. Primer pair A–B was used to detect A-Raf FL isoform. Primer pair A–C was used to detect A-Raf short isoform. Primer pair D–E was used to detect total A-Raf transcripts (see also Supplemental Fig. S5). (B,C) qRT-PCR analysis of A-Raf mRNA isoform expression (B) or the expression ratio of A-Raf FL/A-Raf short (C) in PHM-1 cells transduced with the indicated retroviruses. All samples were normalized to GAPDH mRNA levels and to the expression of the A-Raf short isoform in control (empty vector, pBABE) cells (B) or to the A-Raf FL/A-Raf short ratio in control (pBABE) cells (C), which was arbitrarily set at one (mean ± SEM; n = 3). (D) Immunoblot analysis of A-Raf FL and T7-TAG in cells described in B and C; β-actin was used as loading control. (E) qRT-PCR analysis of A-Raf isoforms in HuH7 cells transduced with retroviruses encoding for specific shRNAs against either hnRNP A1 or hnRNP A2. All samples were normalized to β-actin mRNA levels and to the expression of the A-Raf short isoform in control (empty vector without shRNA, MLP) cells, which was arbitrarily set at one (mean ± SEM; n = 3). (F) Total protein from cells described in E was extracted, and the expression levels of hnRNP A1/A1b, hnRNP A2/B1, A-Raf FL, and A-Raf short were assessed by Western blotting. β-Actin was used as a loading control.
FIGURE 6.
FIGURE 6.
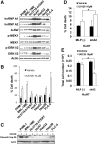
Sensitivity of HCC cells to MEK inhibitor–induced apoptosis correlates with hnRNP A1 and A2 levels. (A) Cells were lysed, and protein levels of hnRNP A2/B1, hnRNP A1/A1b, A-Raf FL and total and phosphorylated MEK1/2 and ERK1/2 were examined using Western blot. β-Actin was used as loading control. (B) HCC cell lines were treated either with vehicle or MEK inhibitor U0126 (10 µM) for 24 h and subjected to trypan blue exclusion assay. (C) Cells described in A and B were analyzed by Western blot for cleaved caspase-3, a marker for apoptosis. β-Actin served as loading control. (D) HuH7 cells transduced with the indicated retroviruses were seeded (120 × 104 cells/well in a six-well plate in triplicates) and treated with either vehicle or MEK inhibitor U0126 (10 µM) for 48 h and subjected to trypan blue exclusion assay. (*) Increased apoptosis after U0126 treatment in hnRNP A2 knockdown compared with MLP. P = 0.053. (E) Cells described in D were counted (total cell number) by a BioRad cell counter. (*) Reduced cell number after U0126 treatment in hnRNP A2 knockdown compared with MLP. P = 0.033. Experiments described in D and E were repeated at least twice.

Similar articles

Cited by

References

    1. Allemand E, Guil S, Myers M, Moscat J, Caceres JF, Krainer AR 2005. Regulation of heterogenous nuclear ribonucleoprotein A1 transport by phosphorylation in cells stressed by osmotic shock. Proc Natl Acad Sci 102: 3605–3610 - PMC - PubMed
    1. Anczukow O, Rosenberg AZ, Akerman M, Das S, Zhan L, Karni R, Muthuswamy SK, Krainer AR 2012. The splicing factor SRSF1 regulates apoptosis and proliferation to promote mammary epithelial cell transformation. Nat Struct Mol Biol 19: 220–228 - PMC - PubMed
    1. Blanchette M, Chabot B 1997. A highly stable duplex structure sequesters the 5′ splice site region of hnRNP A1 alternative exon 7B. RNA 3: 405–419 - PMC - PubMed
    1. Boukakis G, Patrinou-Georgoula M, Lekarakou M, Valavanis C, Guialis A 2010. Deregulated expression of hnRNP A/B proteins in human non-small cell lung cancer: Parallel assessment of protein and mRNA levels in paired tumour/non-tumour tissues. BMC Cancer 10: 434. - PMC - PubMed
    1. Burd CG, Swanson MS, Gorlach M, Dreyfuss G 1989. Primary structures of the heterogeneous nuclear ribonucleoprotein A2, B1, and C2 proteins: A diversity of RNA binding proteins is generated by small peptide inserts. Proc Natl Acad Sci 86: 9788–9792 - PMC - PubMed

Publication types

MeSH terms

Substances

LinkOut - more resources