. 2014 Feb 27:5:3405.
doi: 10.1038/ncomms4405.

An antagonistic interaction between PlexinB2 and Rnd3 controls RhoA activity and cortical neuron migration

Affiliations
Free PMC article

An antagonistic interaction between PlexinB2 and Rnd3 controls RhoA activity and cortical neuron migration

Roberta Azzarelli et al. Nat Commun. .
Free PMC article

Abstract

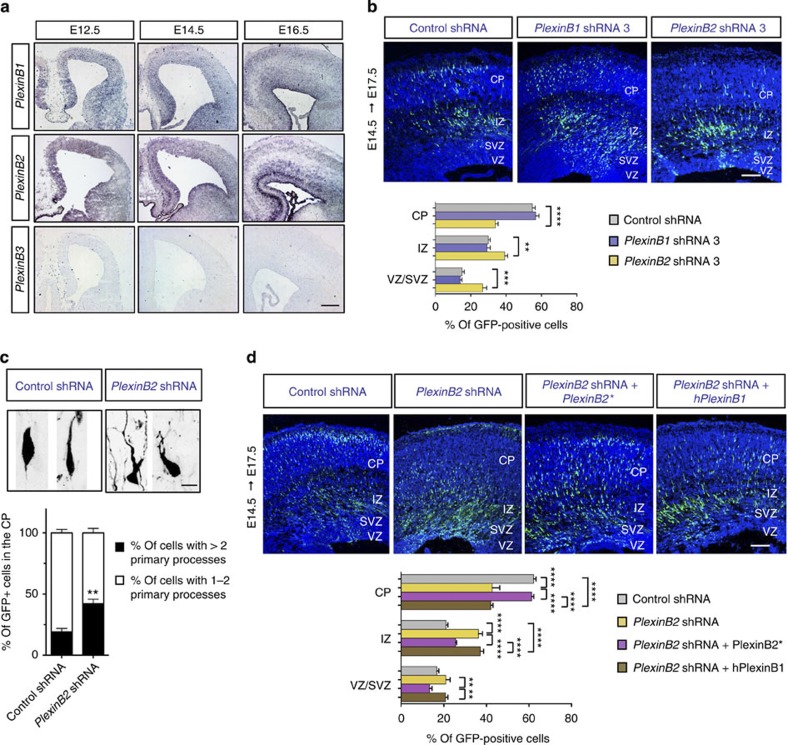
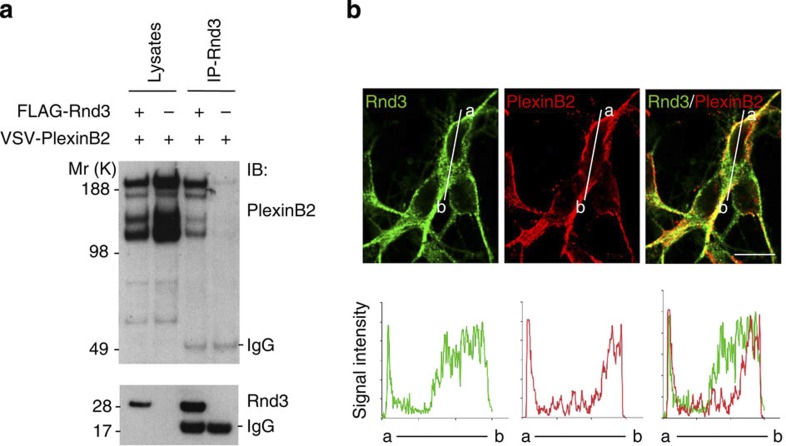
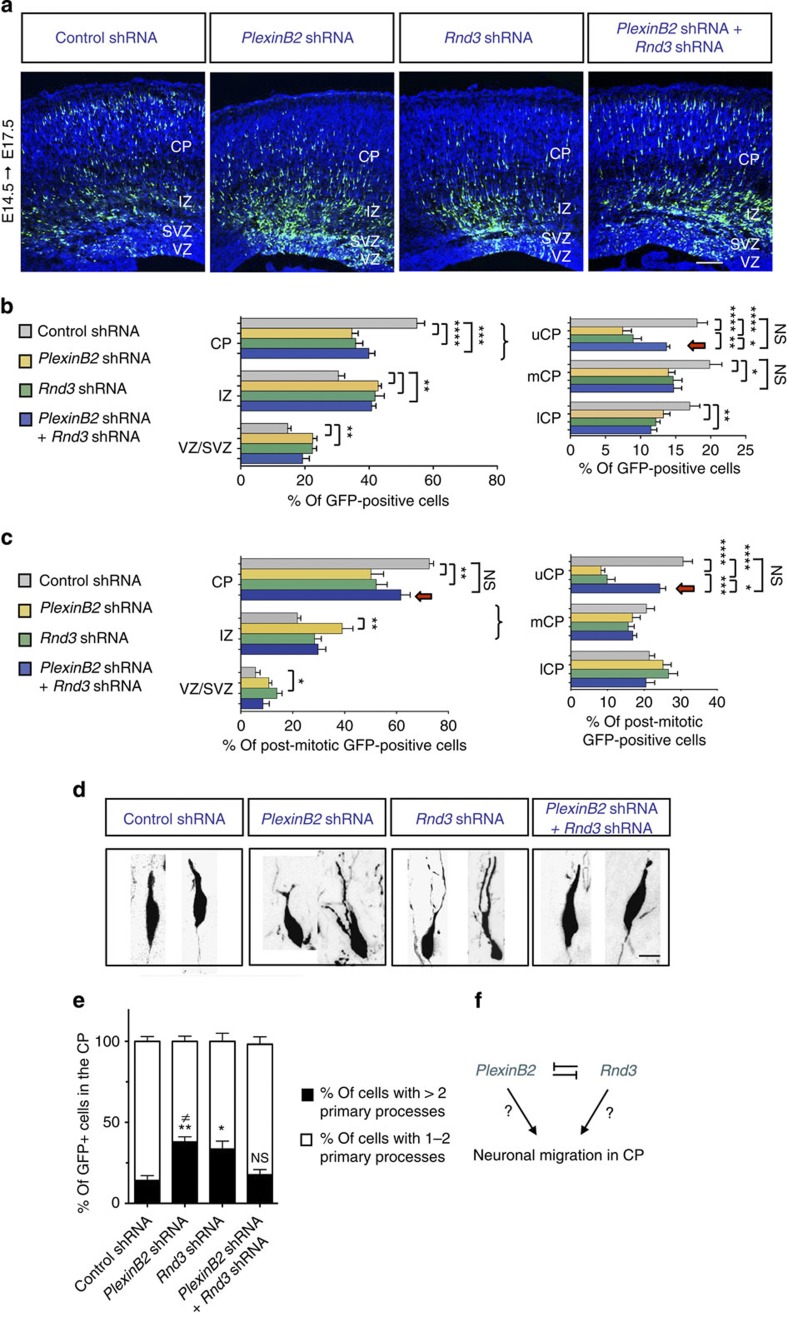
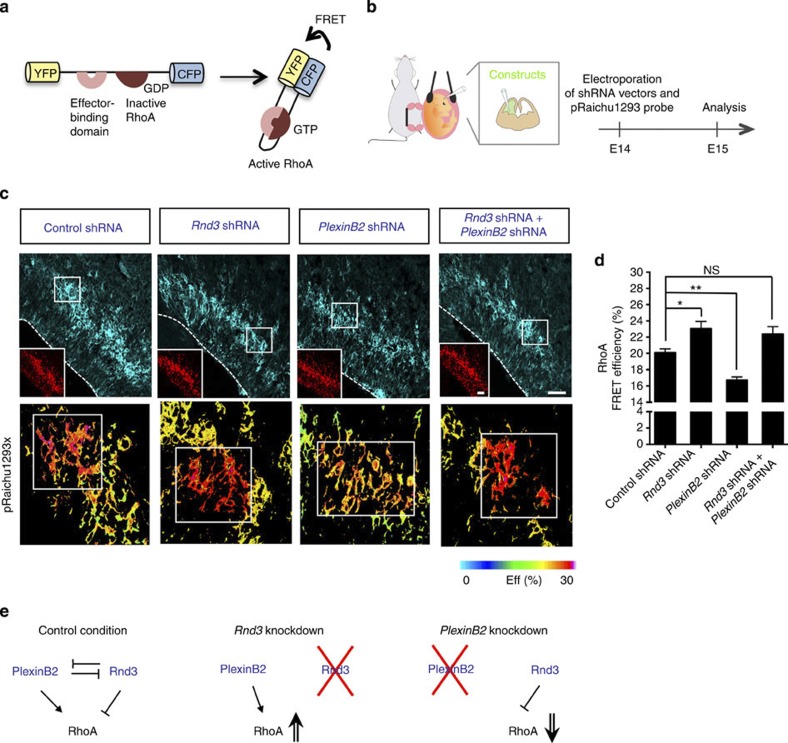
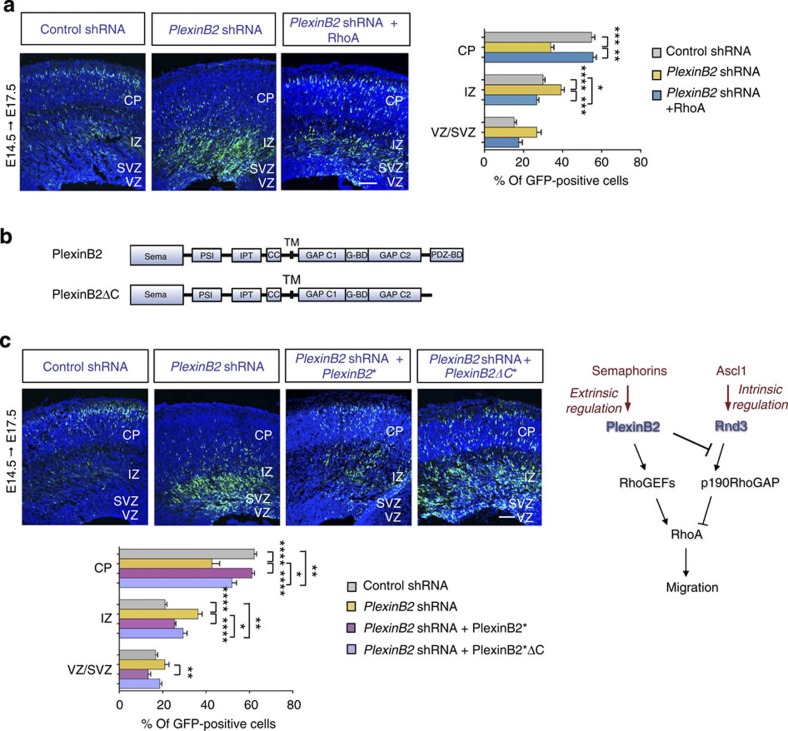
A transcriptional programme initiated by the proneural factors Neurog2 and Ascl1 controls successive steps of neurogenesis in the embryonic cerebral cortex. Previous work has shown that proneural factors also confer a migratory behaviour to cortical neurons by inducing the expression of the small GTP-binding proteins such as Rnd2 and Rnd3. However, the directionality of radial migration suggests that migrating neurons also respond to extracellular signal-regulated pathways. Here we show that the Plexin B2 receptor interacts physically and functionally with Rnd3 and stimulates RhoA activity in migrating cortical neurons. Plexin B2 competes with p190RhoGAP for binding to Rnd3, thus blocking the Rnd3-mediated inhibition of RhoA and also recruits RhoGEFs to directly stimulate RhoA activity. Thus, an interaction between the cell-extrinsic Plexin signalling pathway and the cell-intrinsic Ascl1-Rnd3 pathway determines the level of RhoA activity appropriate for cortical neuron migration.


Figures

Figure 1
Figure 1. Plexin B2 regulates the migration and the morphology of cortical neurons.
(a) Distribution of Plexin B1, Plexin B2 and Plexin B3 transcripts in coronal sections from E12.5, E14.5 and E16.5 mouse brains. Scale bar, 250 μm. (b) Migration analysis of cortical neurons electroporated in utero with Plexin B1 or Plexin B2 shRNAs at E14.5 and analysed 3 days later. Most Plexin B2-silenced neurons failed to reach the upper layers of the cortex in comparison with Plexin B1 shRNA or control-treated neurons. TOTO-3 was used to label nuclei and subdivide the cortical wall into cortical plate (CP), IZ and subventricular zone/ventricular zone (SVZ/VZ). The quantification graph shows the distribution of GFP-positive cells in different zones of the cortex (VZ/SVZ, IZ and CP) in the different electroporation experiments. Data are presented as the mean±s.e.m. from six sections prepared from three embryos obtained from two or three litters. One-way ANOVA followed by the Bonferroni post-hoc test; **P<0.01, ***P<0.001, ****P<0.0001. Scale bar, 200 μm. (c) Morphology of electroporated cells in the CP. Many Plexin B2-silenced neurons displayed abnormal morphologies, characterized by a branch-leading process or supernumerary primary processes. Scale bar, 10 μm. Quantification graph shows the proportion of cells exhibiting more than two primary processes (in black); n>150 cells from three different brains. Student’s t-test; **P<0.01 compared with control. (d) The radial migration defect of PlexinB2-deficient neurons was rescued by overexpression of a shRNA-resistant version of Plexin B2 (Plexin B2*), but not by overexpression of human Plexin B1 (hPlexinB1). Mean±s.e.m. from six sections prepared from three different experiments; one-way ANOVA followed by the Bonferroni post hoc test; **P<0.01, ****P<0.0001. Scale bar: 200 μm.
Figure 2
Figure 2. Plexin B2 and Rnd3 interact biochemically.
(a) Rnd3 co-immunoprecipitates with Plexin B2. P19 cells were transfected with VSV-Plexin B2 alone or in combination with FLAG-Rnd3 as indicated. The lysates were immunoprecipitated with anti-FLAG antibody and immunoblotted with anti-VSV or anti-FLAG antibodies. For full blots see Supplementary Fig. 6. (b) Distribution of Plexin B2 and Rnd3 proteins in cortical neurons dissociated at E14.5 and cultured for 4 days. Plexin B2 (in red) and Rnd3 (in green) co-localize at the plasma membrane, as shown by the intensity profile along the a–b line. Scale bar, 10 μm.
Figure 3
Figure 3. Plexin B2 and Rnd3 antagonize each other’s activities in radially migrating neurons.
(a) Mouse embryonic cortices electroporated with control shRNA, Plexin B2 shRNA, Rnd3 shRNA or Plexin B2 and Rnd3 shRNAs together at E14.5 and analysed 3 days later. The migration defect produced by Rnd3 or Plexin B2 silencing was partially rescued by the concomitant knockdown of the two genes. Scale bar, 200 μm. (b) The quantification graph compares the distribution of GFP+ cells in the different electroporation experiments. The CP is further subdivided into lower CP (lCP), median CP (mCP) and upper CP (uCP). The red arrow in the quantification graph highlights the migratory rescue in the uCP. Mean±s.e.m. from six sections prepared from three different experiments; one-way ANOVA followed by the Bonferroni post hoc test; *P<0.05, **P<0.01, ***P<0.001 and ****P<0.0001; NS, not significant. (c) The graph reports the distribution of post-mitotic (GFP+/ki67−) cells in the different experiments. The red arrows indicate the migratory rescue when both Plexin B2 and Rnd3 are silenced. Mean±s.e.m. from six sections prepared from three different experiments; one-way ANOVA followed by the Bonferroni post hoc test; *P<0.05, **P<0.01, ***P<0.001 and ****P<0.0001; NS, not significant. (d) Morphology of radially migrating neurons electroporated with the different constructs as indicated. Aberrant shapes were observed in both Plexin B2-silenced neurons and Rnd3-silenced down cells. Scale bar, 10 μm. (e) Quantification of the morphologies of electroporated cells in the CP. The percentages represent the proportion of cells exhibiting more than two primary processes (that is, attached to the cell body). n>150 cells from three different brains. One-way ANOVA followed by the Bonferroni post hoc test; *P<0.05 and **P<0.01 compared with control, P<0.05 compared with double knockdown. (f) Drawing of the genetic interaction between Plexin B2 and Rnd3. The two factors antagonize each other’s activities in the control of neuronal migration and morphology in the CP.
Figure 4
Figure 4. Plexin B2 activates RhoA in migrating neurons in part by inhibiting Rnd3.
(a,b) Schematic representation of the experimental approach. An intra-molecular FRET probe (pRaichu1293) was used to measure the levels of active (GTP-bound) RhoA at the cell membrane (a). The probe and shRNA constructs were co-electroporated in utero at E14.5 and electroporated cells were analysed 1 day later in brain slices (b). (c) In vivo FRET analysis of RhoA activity performed on cortical slices electroporated with different constructs as indicated. Upper panels show the CFP signal from the FRET probe (scale bar, 50 μm); the RFP signal in insets marks electroporated cells (scale bar in insets, 50 μm). Lower panels show FRET efficiency in the indicated area (white rectangles indicate the bleached area). (d) Quantification graph showing the level of FRET signals in electroporated cortical cells in the different conditions. Mean±s.e.m.; one-way ANOVA followed by the Bonferroni post hoc test; *P<0.05, **P<0.01; NS, not significant. n>12 areas for each condition, deriving from at least three different embryos from three different litters. (e) Model of RhoA regulation by Plexin B2 and/or Rnd3 in the different experiments.
Figure 5
Figure 5. p190RhoGAP mediates Rnd3 inhibitory function towards RhoA and competes with Plexin B2 for Rnd3 binding.
(a) In vitro FRET analysis of RhoA activity in dissociated cortical cells in culture, 2 days after the electroporation of the constructs indicated. Upper panels show the CFP signal from the FRET probe; the RFP signal (in insets) marks electroporated cells (scale bar in insets, 10 μm). Lower panels show FRET efficiency. Scale bar, 10 μm. (b) Mean±s.e.m.; (n>11 cells for each condition, from three independent experiments; t-test: *P<0.05 and **P<0.01 compared with control). (c) Mouse embryonic cortices electroporated in utero with control shRNA or p190RhoGAP shRNA at E14.5 and analysed 3 days later. Scale bar, 200 μm. The distribution of GFP+ cells in the different cortical compartments revealed defects in the migration of p190RhoGAP-depleted neurons. Mean±s.e.m. from six sections prepared from three different experiments; t-test; **P<0.01 and ****P<0.0001. (d) Plexin B2 interacts with the same site as p190RhoGAP on Rnd3 protein. COS7 cells were co-transfected with HA-PlexinB2 (cytoplasmic domain) and wild-type and mutated (T55V) FLAG-Rnd3 constructs. The lysates were immunoprecipitated (IP) with anti-FLAG antibody and immunoblotted with anti-HA or anti-FLAG antibodies. The mutation of a single residue, Threonine 55 in the effector binding domain, of Rnd3 disrupted the interaction with Plexin B2, similar to p190RhoGAP. (e) Competition between Plexin B2 and p190RhoGAP for Rnd3 binding. Expression vectors encoding FLAG-Rnd3 and Myc-p190RhoGAP-B (middle domain) were co-transfected with increasing amounts of VSV-Plexin B2 into COS7 cells. Cell lysates were IP with anti-FLAG antibody, then immunoblotted with the indicated antibodies. For full blots see Supplementary Fig. 6.
Figure 6
Figure 6. Plexin B2 activates RhoA in the cortex in part by recruiting RhoGEFs.
(a) The migration defect induced by Plexin B2 shRNA electroporation was rescued by co-electroporation of a RhoA expression vector. The graph shows the distribution of electroporated GFP-positive cells per cortical compartment in the different conditions. Mean±s.e.m. from six sections prepared from three different experiments; one-way ANOVA followed by the Bonferroni post-hoc test; *P<0.05, **P<0.01, ***P<0.001 and ****P<0.0001. Scale bar, 200 μm. (b) Schematic representation of the different domains of the Plexin B2 protein. The PDZ-binding domain (PDZ-BD) at the C terminus of wild-type Plexin B2 has been removed in the Plexin B2 C-terminal deletion mutant (PlexinB2ΔC). Sema: Sema domain; PSI: plexin, semaphorin and integrin domain; IPT: Ig-like, plexin and transcritpion factor domain; CC: convertase cleavage site; TM: transmembrane domain; GAP C1/C2: segmented GTPase activating protein (GAP) domain; G-BD: GTPase binding domain; PDZ-BD: PDZ-binding domain. (c) Images of electroporated cortices and quantification graph show that PlexinB2ΔC* ameliorates the defects induced by Plexin B2 knockdown, although not as efficiently as wild type PlexinB2*. The star (*) indicates that the constructs carry mutations conferring RNAi resistance. Mean±s.e.m. from six sections prepared from three different experiments; one-way ANOVA followed by the Bonferroni post hoc test; *P<0.05, **P<0.01 and ****P<0.0001. Scale bar, 200 μm. (d) Model of how the Ascl1-Rnd3 and Semaphorin-PlexinB2 interact to regulate RhoA activity in cortical neuronal migration. On the one hand, Ascl1-Rnd3 maintains low background levels of RhoA activity by interacting with p190RhoGAP. On the other hand, upon extracellular activation, Plexin B2 promotes RhoA activation by two mechanisms, blocking Rnd3 interaction with p190RhoGAP and directly recruiting RhoGEFs.

References

    1. Guerrini R. & Parrini E. Neuronal migration disorders. Neurobiol. Dis. 38, 154–166 (2010). - PubMed
    1. Francis F. et al. Human disorders of cortical development: from past to present. Eur. J. Neurosci. 23, 877–893 (2006). - PubMed
    1. Barkovich A. J., Kuzniecky R. I., Jackson G. D., Guerrini R. & Dobyns W. B. A developmental and genetic classification for malformations of cortical development. Neurology 65, 1873–1887 (2005). - PubMed
    1. Kriegstein A. R. & Noctor S. C. Patterns of neuronal migration in the embryonic cortex. Trends Neurosci. 27, 392–399 (2004). - PubMed
    1. Marin O., Valdeolmillos M. & Moya F. Neurons in motion: same principles for different shapes? Trends Neurosci. 29, 655–661 (2006). - PubMed

Publication types

MeSH terms