. 2014 Feb 26;34(9):3218-30.
doi: 10.1523/JNEUROSCI.3080-13.2014.

Nonvisual complex spike signals in the rabbit cerebellar flocculus

Affiliations

Nonvisual complex spike signals in the rabbit cerebellar flocculus

Beerend H J Winkelman et al. J Neurosci. .

Abstract

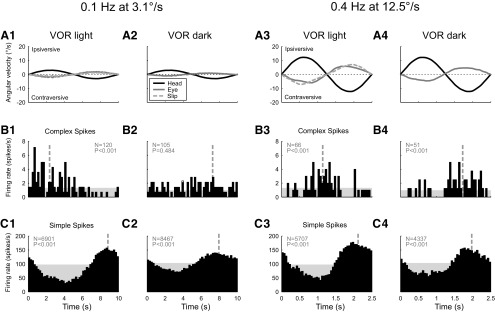
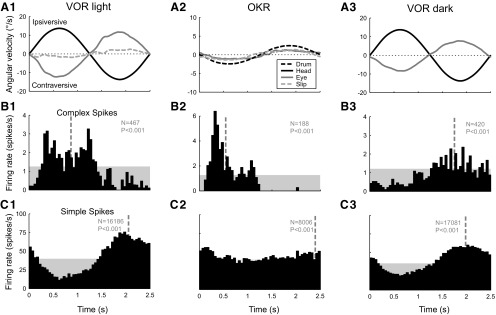
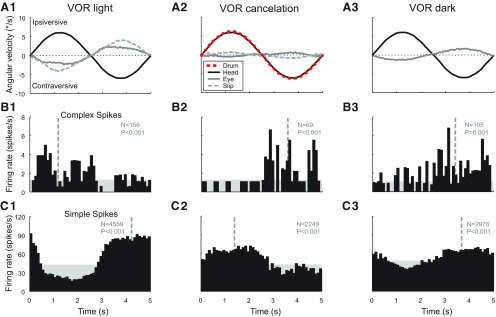
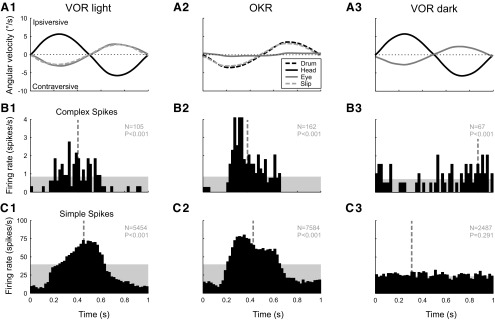
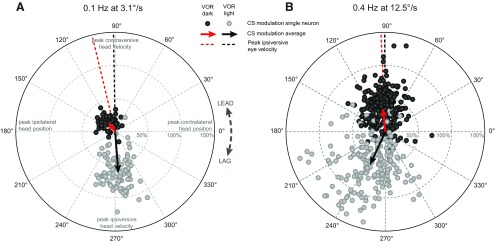
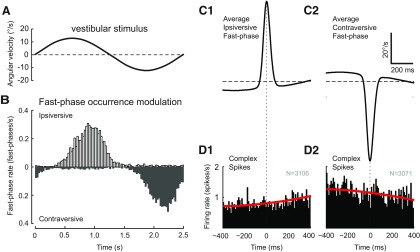
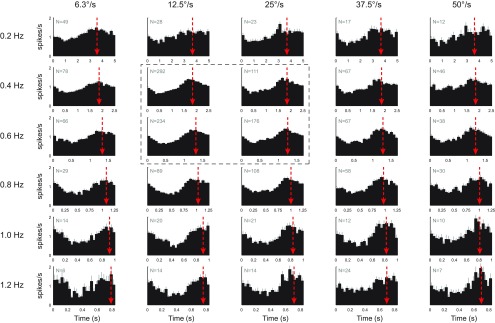
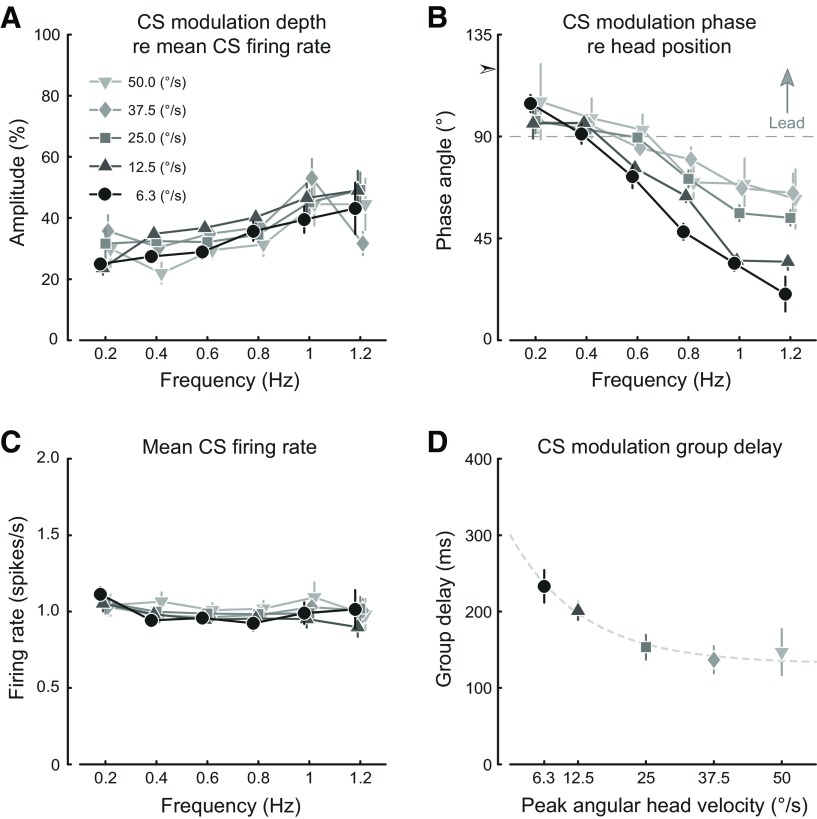
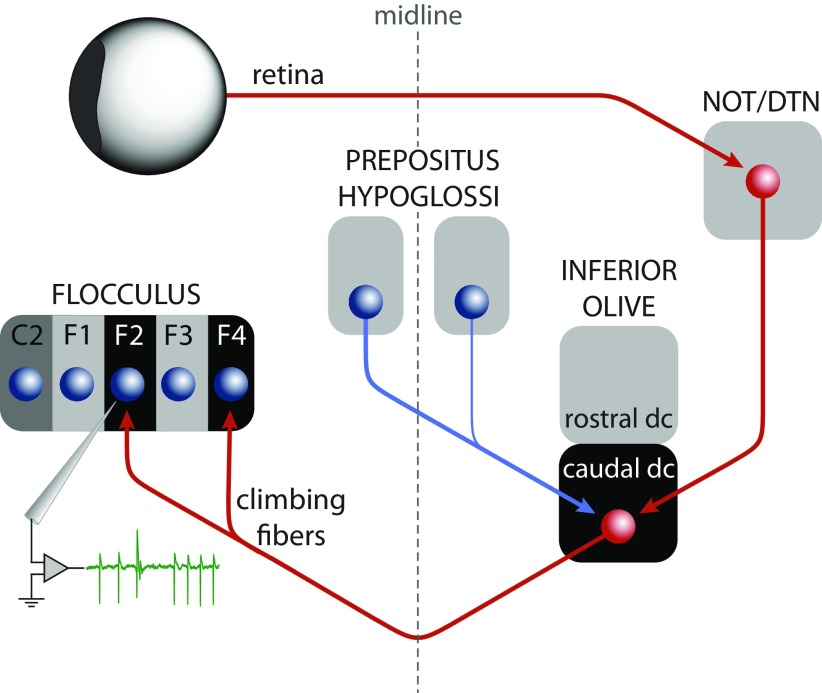
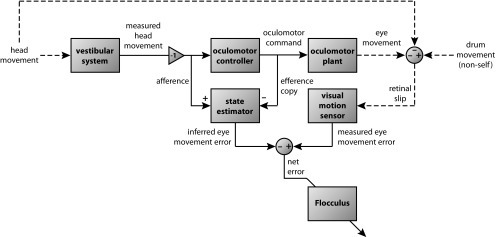
In addition to the well-known signals of retinal image slip, floccular complex spikes (CSs) also convey nonvisual signals. We recorded eye movement and CS activity from Purkinje cells in awake rabbits sinusoidally oscillated in the dark on a vestibular turntable. The stimulus frequency ranged from 0.2 to 1.2 Hz, and the velocity amplitude ranged from 6.3 to 50°/s. The average CS modulation was evaluated at each combination of stimulus frequency and amplitude. More than 75% of the Purkinje cells carried nonvisual CS signals. The amplitude of this modulation remained relatively constant over the entire stimulus range. The phase response of the CS modulation in the dark was opposite to that during the vestibulo-ocular reflex (VOR) in the light. With increased frequency, the phase response systematically shifted from being aligned with contraversive head velocity toward peak contralateral head position. At fixed frequency, the phase response was dependent on peak head velocity, indicating a system nonlinearity. The nonvisual CS modulation apparently reflects a competition between eye movement and vestibular signals, resulting in an eye movement error signal inferred from nonvisual sources. The combination of this error signal with the retinal slip signal in the inferior olive results in a net error signal reporting the discrepancy between the actual visually measured eye movement error and the inferred eye movement error derived from measures of the internal state. The presence of two error signals requires that the role of CSs in models of the floccular control of VOR adaption be expanded beyond retinal slip.

Keywords: Purkinje cell; accessory optic system; climbing fiber; complex spike; inferior olive; prepositus hypoglossi.


Figures

Figure 1.
Figure 1.
Histograms of single-unit activity of an individual floccular VA Purkinje cell recorded during vestibular stimulation in the light (columns 1 and 3) and in the dark (columns 2 and 4). Columns 1 and 2 show the responses to low-frequency, low-velocity rotation (0.1 Hz at 3.1°/s) about the vertical axis. In columns 3 and 4, the stimulus parameters were increased (0.4 Hz at 12.5°/s). A, Average angular velocity of the head (black line), the slow-phase eye movement (gray line), and the residual retinal image slip (light-gray dashed line). B, Average CS firing rate. C, Average simple spike firing rate. The level of the shaded area indicates the spontaneous firing rate; the vertical dashed line indicates the circular mean of the spike events. Spike count (N) and significance of modulation (P, Rayleigh's R2 test) are indicated in gray in each panel.
Figure 2.
Figure 2.
Histograms of the single-unit activity of an individual floccular VA Purkinje cell recorded during three different stimulus conditions: vestibular stimulation in the light (column 1), optokinetic stimulation (column 2), and vestibular stimulation in the dark (column 3). The stimulus frequency was 0.4 Hz. A, Average angular velocity of the head (black line), the slow-phase eye movement (gray line), and the residual retinal image slip (light-gray dashed line). B, Average CS firing rate. C, Average simple spike firing rate. The amplitude of the optokinetic stimulus (A2, black dashed line) was set to 2.5°/s, so that the magnitude of the retinal image slip (light gray dashed line) approximately matched that of the slip during vestibular stimulation in the light (A1).
Figure 3.
Figure 3.
Histograms of single-unit activity of a floccular VA Purkinje cell recorded during vestibular stimulation (0.2 Hz, 6.3°/s) under three different visual conditions: in the light with a stationary visual surround (column 1), in the light with a visual surround that moved in phase with the turntable (VOR cancellation, column 2), and in the dark (column 3). A, Average angular velocity of the head (black line), the slow-phase eye movement (gray line), and the residual retinal image slip (light-gray dashed line). B, Average CS firing rate. C, Average simple spike firing rate. The average angular velocity of the optokinetic drum is indicated with the red dashed line in A2.
Figure 4.
Figure 4.
Histograms of single-unit activity of a cell representing a minority of floccular VA Purkinje cells for which the SSs fire in phase with the CSs. The cell was recorded during three different stimulus conditions as in Figure 3: vestibular stimulation in the light (column 1), optokinetic stimulation (column 2), and vestibular stimulation in the dark (column 3). The stimulus frequency was 1.0 Hz. A, Average angular velocity of the head (black line), the slow-phase eye movement (gray line), and the residual retinal image slip (light-gray dashed line). B, Average CS firing rate. C, Average simple spike firing rate. The amplitude of the optokinetic stimulus (A2, black dashed line) was set to 3.5°/s, so that the magnitude of the retinal image slip (light gray dashed line) approximately matched that of the slip during vestibular stimulation in the light (A1).
Figure 5.
Figure 5.
Comparison of the magnitude and phase angle distribution of the visual and nonvisual CS modulation. A, Results for all cells tested with vestibular stimulation at 0.1 Hz and 3.1°/s peak velocity. B, Results for all cells tested with vestibular stimulation at 0.4 Hz and 12.5°/s peak velocity. The polar plot magnitude corresponds to the amplitude of the CS modulation relative to the average firing frequency. The phase of the CS modulation is relative to peak contralateral head position. Dark gray dots represent cells recorded during vestibular stimulation in the dark; light gray dots represent cells recorded during vestibular stimulation in the light. The arrows indicate the population mean (red for VOR in the dark, black for VOR in the light). Dashed lines indicate the average phase shift of the peak ipsiversive eye velocity relative to peak contralateral head position in the dark (red) and the light (black).
Figure 6.
Figure 6.
Absence of a relation between CS activity in the dark and the fast-phases of vestibular nystagmus. A, Head velocity during one full 0.4 Hz stimulus cycle with 12.5°/s table peak velocity. B, Histogram of the frequency distribution of fast-phase occurrences relative to the stimulus cycle (0.4 Hz at 12.5°/s) for the cells illustrated in Figure 5B. Open bins represent ipsiversive fast-phases; gray bins represent contraversive fast-phases. C, Average of all ipsiversive (C1) and contraversive (C2) fast-phases from the VOR dark dataset presented in Figure 5B. Fast-phases were aligned on peak eye velocity. The averages include a portion of the slow-phase eye movement before and after the fast-phase. D, Average CS activity triggered on the peak velocity of either the ipsiversive (D1) or contraversive (D2) fast-phases shown in C1 and C2, respectively. N values indicate the number of fast-phases. Red lines indicate the fast-phase-triggered CS activity computed from the average CS modulation during slow-phase eye movement.
Figure 7.
Figure 7.
Stimulus frequency and amplitude dependence of the nonvisual CS modulation. The histograms represent the population average of the CS modulation for each tested combination of stimulus frequency and amplitude. The number of cells for each stimulus condition is given by N. The red arrows indicate the circular mean of the CS modulation and show the phase lead relative to peak contralateral head position. Error bars on each bin of the histograms indicate the SEM. Panels inside the dashed outline were used as standard conditions to test for nonvisual CS modulation.
Figure 8.
Figure 8.
Graphic summary of the stimulus frequency and amplitude dependence of the nonvisual CS modulation. A, The dependence of the average CS modulation amplitude on stimulus frequency with stimulus peak velocity as the parameter. B, The dependence of the average CS modulation phase angle on stimulus frequency with stimulus peak velocity as the parameter. The common intercept with the ordinate at 0 Hz is indicated by the arrowhead at a phase angle of 120°. Phase angles are relative to peak contralateral head position. The dashed gray reference line indicates peak contraversive head velocity. C, The dependence of the average CS firing rate on stimulus frequency with stimulus peak velocity as the parameter. D, Group delay of the CS modulation for each stimulus velocity. The dashed gray line is a least-squares exponential function fit. Error bars indicate 95% CI. A–C, The stimulus velocity profiles are presented with small offsets relative to each other along the abscissa to avoid overlapping error bars.
Figure 9.
Figure 9.
Schematic drawing of the input and output relations of the caudal dorsal cap of the inferior olive. The excitatory pathway (red arrows) relays the retinal slip signal via the accessory optic system to the climbing fibers that project to the VA zones (F2 and F4) of the flocculus. Recording from one of these zones is indicated by the green trace, which shows an example of SSs and a CS. The inhibitory projection from the PrH to the caudal dorsal cap (blue arrow) is the proposed source of the nonvisual signals carried by the floccular climbing fibers.
Figure 10.
Figure 10.
Functional block diagram showing the sources of error signals that contribute to the climbing fiber signal to the flocculus. The state estimator is suggested to be the nuclei prepositus hypoglossi in which afferent vestibular signals are compared with efferent copy eye movement signals to produce an inferred eye movement error signal. The modulation depth of the combination of these two signals, presumed to occur in the nuclei prepositus hypoglossi, is the measure of the inferred error. The nonlinearity of this signal precludes a straightforward prediction of the changes in its modulation depth when its two components, which have opposite polarities, change. The inferred error is sent as an inhibitory input to the inferior olive where it is combined with an excitatory input from the accessory optic system signaling retinal slip, producing a net error signal sent to the flocculus.

Similar articles

Cited by

References

    1. Albus JS. A theory of cerebellar function. Math Biosci. 1971;10:25–61. doi: 10.1016/0025-5564(71)90051-4. - DOI
    1. Alley K, Baker R, Simpson JI. Afferents to the vestibulo-cerebellum and the origin of the visual climbing fibers in the rabbit. Brain Res. 1975;98:582–589. doi: 10.1016/0006-8993(75)90375-3. - DOI - PubMed
    1. Arts MP, De Zeeuw CI, Lips J, Rosbak E, Simpson JI. Effects of nucleus prepositus hypoglossi lesions on visual climbing fiber activity in the rabbit flocculus. J Neurophysiol. 2000;84:2552–2563. - PubMed
    1. Barmack NH, Hess DT. Multiple-unit activity evoked in dorsal cap of inferior olive of the rabbit by visual stimulation. J Neurophysiol. 1980;43:151–164. - PubMed
    1. Barmack NH, Fagerson M, Errico P. Cholinergic projection to the dorsal cap of the inferior olive of the rat, rabbit, and monkey. J Comp Neurol. 1993;328:263–281. doi: 10.1002/cne.903280208. - DOI - PubMed

Publication types

LinkOut - more resources