. 2014 Feb 26;34(9):3291-302.
doi: 10.1523/JNEUROSCI.4610-13.2014.

Functional motifs composed of morphologically homologous neurons repeated in the hindbrain segments

Affiliations

Functional motifs composed of morphologically homologous neurons repeated in the hindbrain segments

Daisuke Neki et al. J Neurosci. .

Abstract

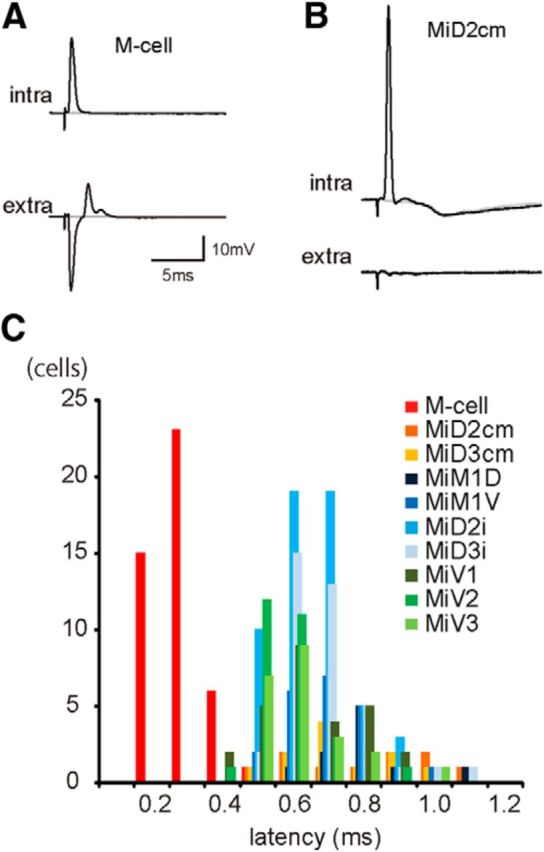
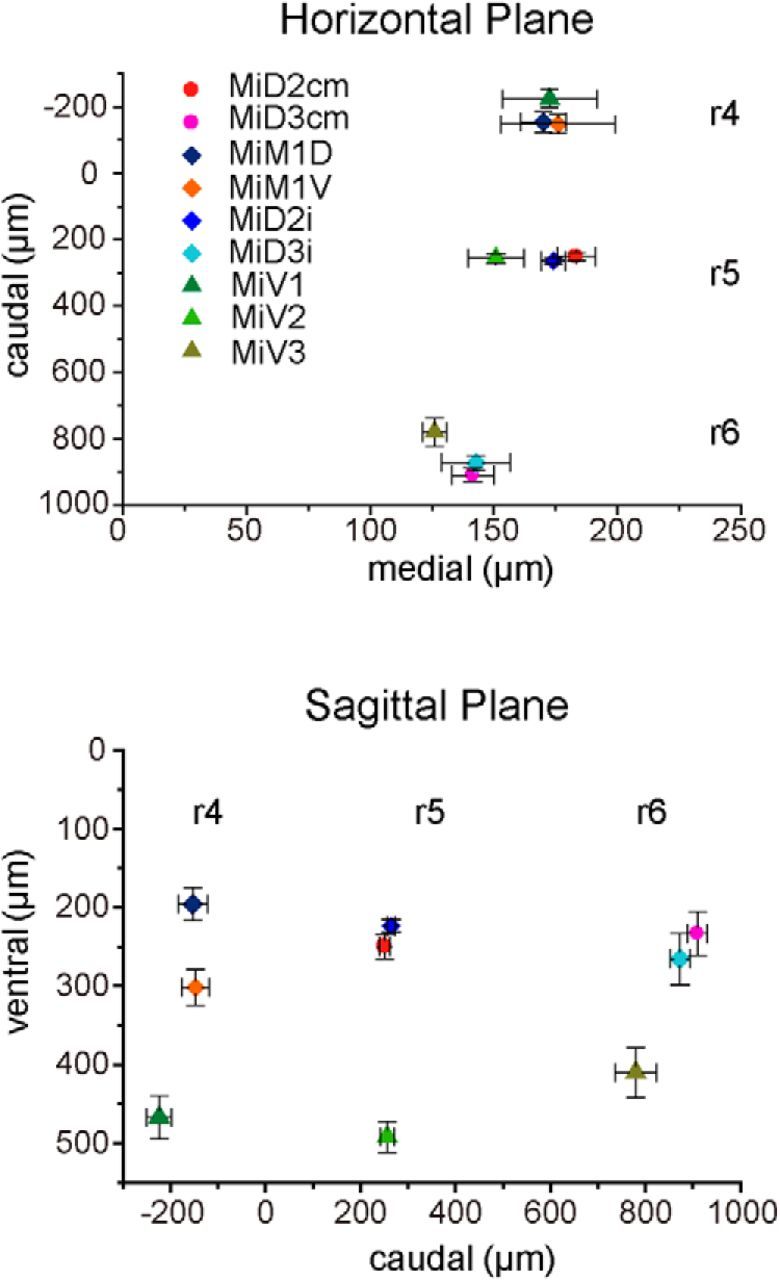
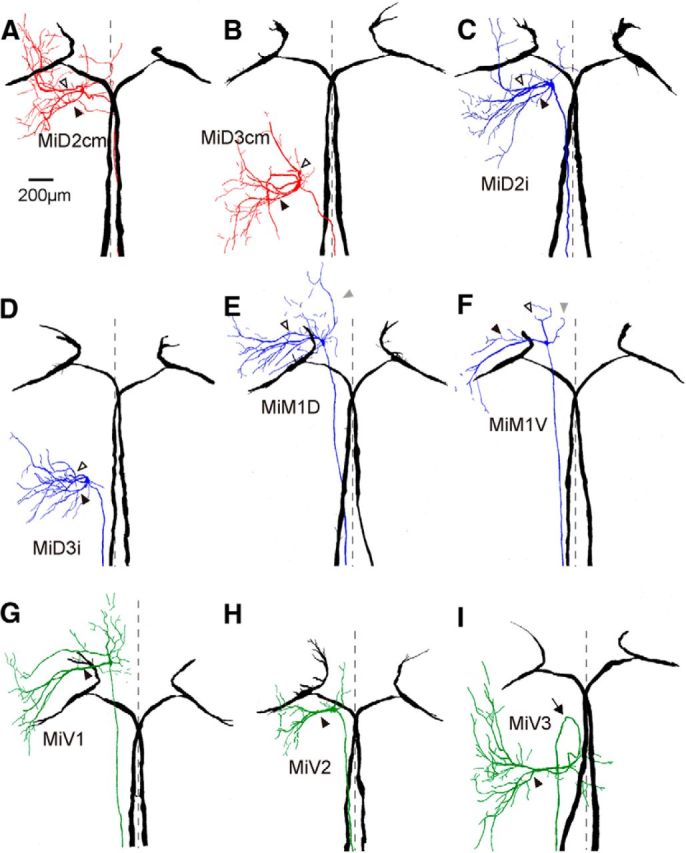
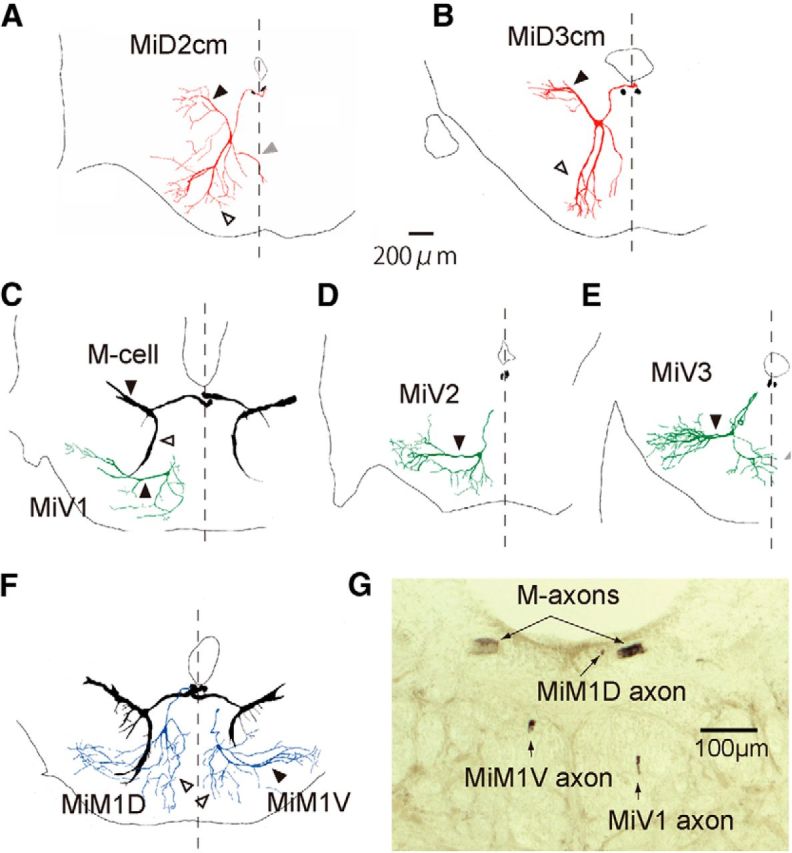
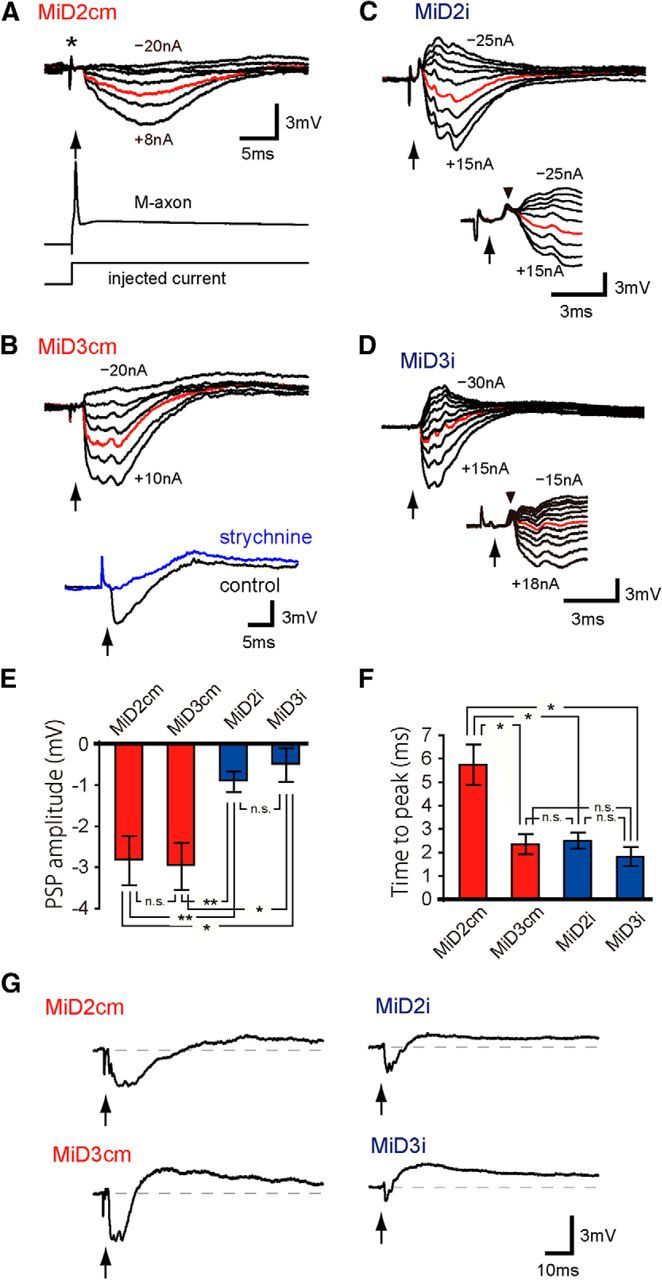
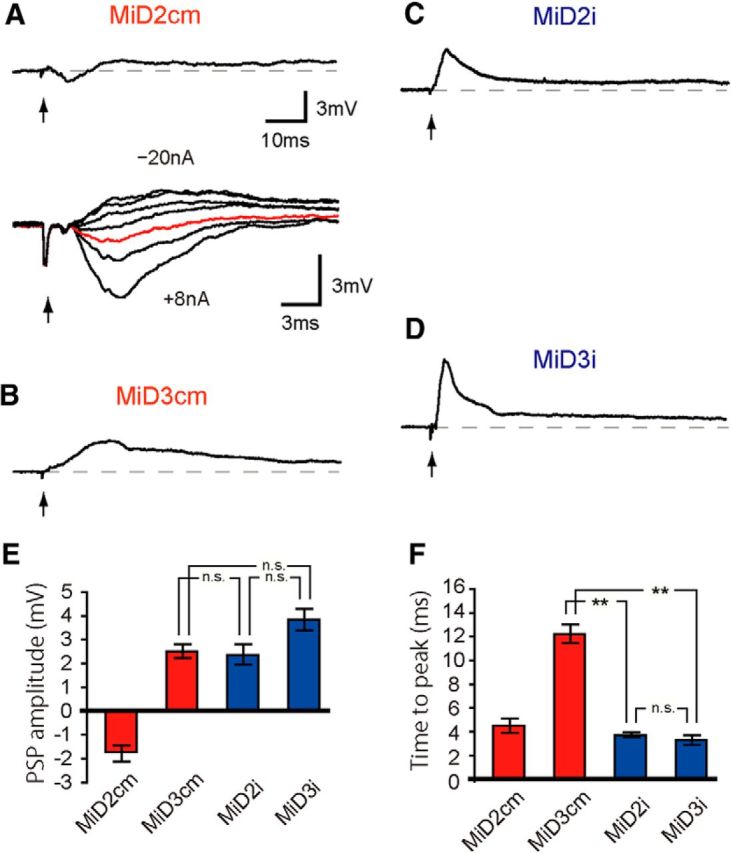
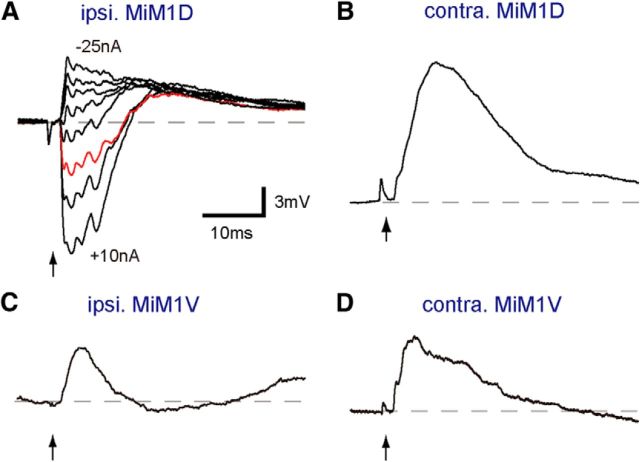
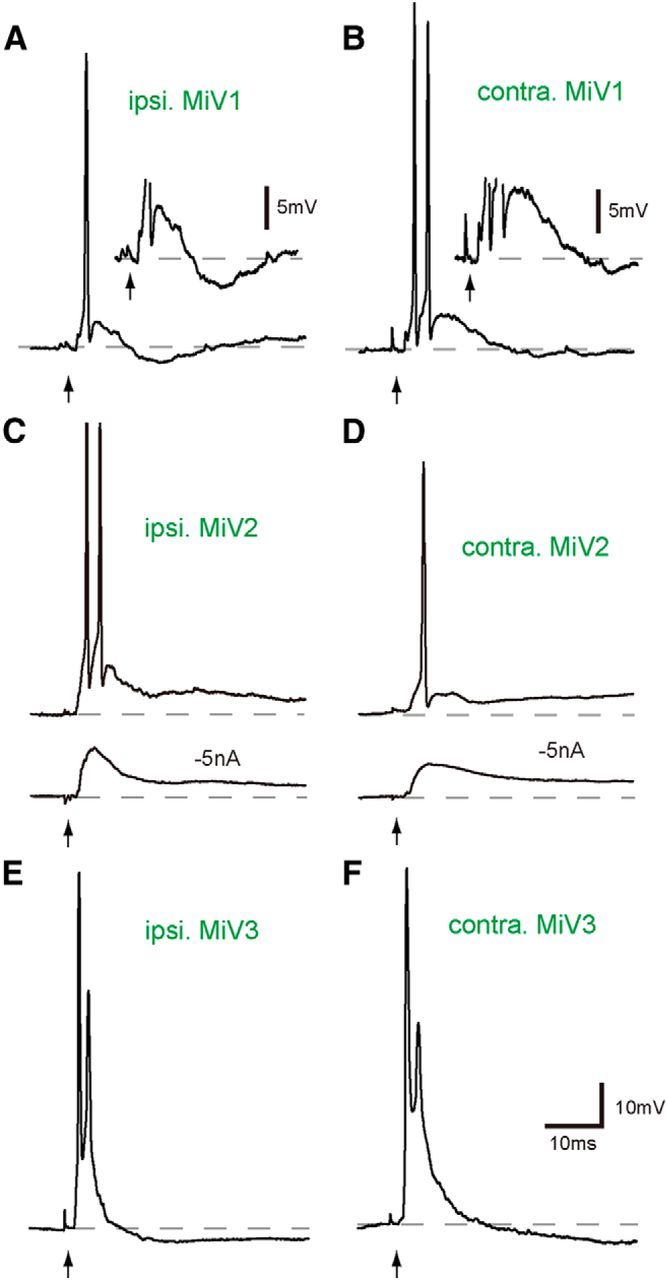
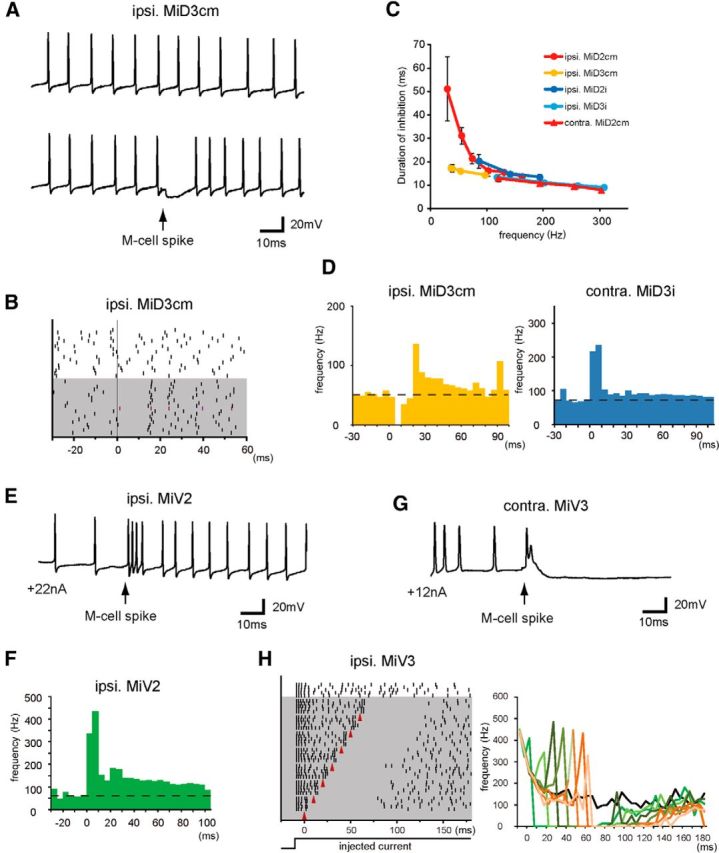
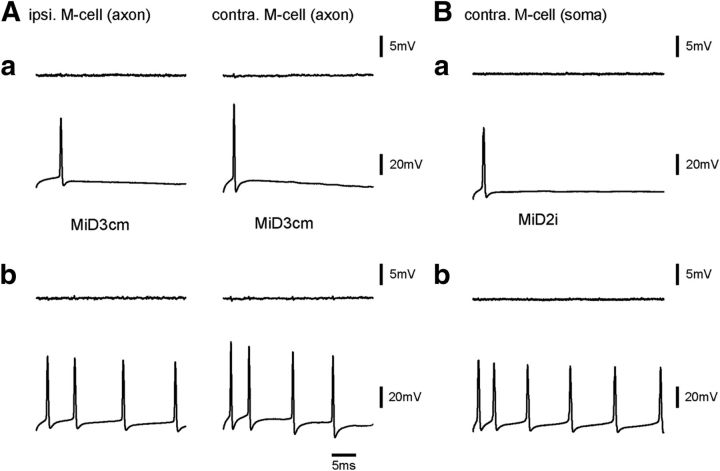
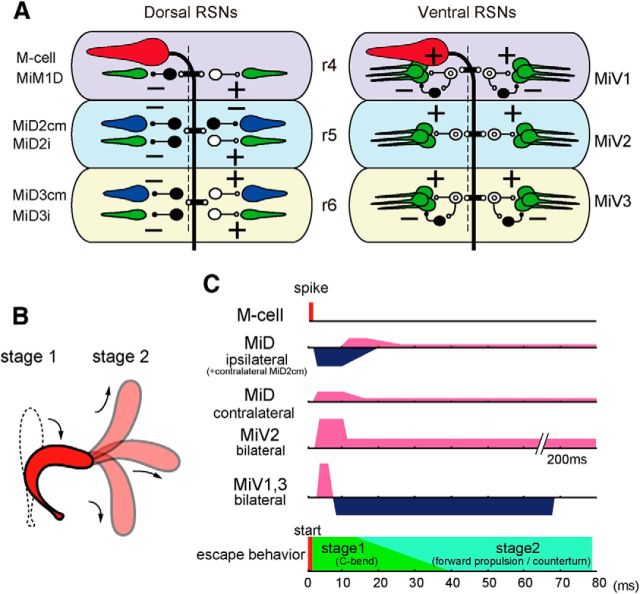
Segmental organization along the neuraxis is a prominent feature of the CNS in vertebrates. In a wide range of fishes, hindbrain segments contain orderly arranged reticulospinal neurons (RSNs). Individual RSNs in goldfish and zebrafish hindbrain are morphologically identified. RSNs sharing similar morphological features are called segmental homologs and repeated in adjacent segments. However, little is known about functional relationships among segmental homologs. Here we investigated the electrophysiological connectivity between the Mauthner cell (M-cell), a pair of giant RSNs in segment 4 (r4) that are known to trigger fast escape behavior, and different series of homologous RSNs in r4-r6. Paired intracellular recordings in adult goldfish revealed unidirectional connections from the M-cell to RSNs. The connectivity was similar in morphological homologs. A single M-cell spike produced IPSPs in dorsally located RSNs (MiD cells) on the ipsilateral side and excitatory postsynaptic depolarization on the contralateral side, except for MiD2cm cells. The inhibitory or excitatory potentials effectively suppressed or enhanced target RSNs spiking, respectively. In contrast to the lateralized effects on MiD cells, single M-cell spiking elicited equally strong depolarizations on bilateral RSNs located ventrally (MiV cells), and the depolarization was high enough for MiV cells to burst. Therefore, the morphological homology of repeated RSNs in r4-r6 and their functional M-cell connectivity were closely correlated, suggesting that each functional connection works as a functional motif during the M-cell-initiated escape.

Keywords: Mauthner cell; escape; hindbrain segments; homologous neurons; reticulospinal neurons; vertebrate.


Figures

Figure 1.
Figure 1.
Electrophysiological identification of reticulospinal neurons in r4–r6. A, B, Antidromically evoked AP in the M-cell (A) and a MiD2cm cell (B). Top traces are intracellularly recorded APs (intra) that occurred in response to spinal cord stimulation at threshold intensities, and APs were observed in an all-or-nothing manner. Corresponding extracellular (extra) field potentials are shown below. Failures are represented by gray traces. Resting membrane potential (Erest) was −80 mV in both the M-cell and MiD2cm cell. The calibration in A is also applicable to B. C, Frequency distribution of the onset latencies of antidromic spikes from spinal stimulation. The latencies of the M-cells (red) were distinctively shorter than those of other RSNs (p < 0.001, Mann–Whitney U test): 0.29 ± 0.01 ms (mean ± SEM; range, 0.16–0.48; n = 45) in the M-cell, 0.68 ± 0.03 ms (n = 22) in MiD2cm, 0.58 ± 0.02 ms (n = 28) in MiD3cm, 0.82 ± 0.06 ms (n = 10) in MiM1D, 0.73 ± 0.04 ms (n = 11) in MiM1V, 0.64 ± 0.01 ms (n = 56) in MiD2i, 0.62 ± 0.03 ms (n = 22) in MiD3i, 0.81 ± 0.04 ms (n = 10) in MiV1, 0.63 ± 0.03 ms (n = 27) in MiV2, and 0.75 ± 0.02 ms (n = 20) in MiV3.
Figure 2.
Figure 2.
Positions of reticulospinal neurons in r4–r6 as represented by three-dimensional distances from the axon cap of the Mauthner cell. Caudomedial (top) and ventrocaudal (bottom) distances from the axon cap of the M-cell to the somata of intracellularly recorded RSNs. There were distinct spaces between RSNs in three segments (r4–r6) along the rostrocaudal and dorsoventral axes. MiD2cm cells (n = 15), MiD3cm cells (20), MiD2i cells (32), MiD3i cells (11), MiM1D cells (7), MiM1V cells (5), MiV1 cells (10), MiV2 cells (24), and MiV3 cells (10).
Figure 3.
Figure 3.
Horizontally stacked images of the Mauthner cell and reticulospinal neurons in r4–r6. Camera lucida reconstructions from serial horizontal sections of paired, recorded, and intracellularly labeled the M-cells in r4 (black) and RSNs in r4–r6. The somata of all of types of RSNs fell into tidy segments, but their dendrites protruded away from their own segments and projected to the adjacent segments. A, B, Left MiD2cm cell in r5 (A) and MiD3cm cell in r6 (B) with bilateral M-cells. Both were located dorsally and had a stem axon that projected to the contralateral spinal cord as the M-cell. Broken lines indicate the midline (same in following traces of Figs. 3, 4). Filled arrowheads indicate the lateral dendrites, and open arrowheads indicate the ventral dendrites, which is the same in the following traces in Figures 3 and 4. C, D, MiD2i cell in r5 (C) and MiD3i cell in r6 (D), which had an axon that projected to the ipsilateral spinal cord. E, F, MiM1 cells in r4, of which an axon projected to the ipsilateral spinal cord were subdivided into dorsally located MiM1D (E) and more ventrally located MiM1V cells (F): MiM1D cell possesses two main ventral dendrites that project ventrolaterally, and MiM1V cell possesses a large lateral dendrite. Both possess a rostral dendrite that projects rostroventrally (gray arrowheads). GI, Ventrally located MiV1 cell in r4 (G), MiV2 cell in r5 (H), and MiV3 cell in r6 (I), which had an axon that projected to the ipsilateral spinal cord. These cells had a major thick lateral dendrite. Four of 10 MiV3 cells had an axon that projected rostrally and then caudally turned back (arrow). Up is rostral. The calibration in A is also applicable to BI.
Figure 4.
Figure 4.
Frontally stacked images of reticulospinal neurons in r4–r6 with the Mauthner cell. Camera lucida reconstructions of rostral view from serial frontal sections of intracellularly labeled the M-cells (black) and other RSNs in r4–r6. A, B, The right MiD2cm cell in r5 (A) and MiD3cm cell in r6 (B) had an axon that dorsally projected to the dorsal bundle of the medial longitudinal fasciculus (mlfd), where the M-axon extended. Sections of bilateral M-axons are shown in black. MiD2cm cells in r5 had a medial dendrite (gray arrowheads) that extended to the midline (broken lines). CE, Ventrally located MiV1 cell in r4 (C), MiV2 cell in r5 (D), and MiV3 cell in r6 (E) had an axon projecting to the ventral bundle of the medial longitudinal fasciculus (mlfv), which was located ventral to the M-axon. F, Simultaneous labeling of MiM1D (left) and MiM1V (right) cells with bilateral M-cells revealed the morphological differences of dendrites: the MiM1D cell possesses ventrally projecting bifurcated dendrites (open arrowhead), whereas the MiM1V cell possesses a thick lateral dendrite (filled arrowhead). Dorsal is up. The calibration in A is also applicable to BF. G, A micrograph of the frontal section at the level of the caudal hindbrain. The MiM1D axon extended along with M-axons in the mlfd, whereas MiM1V and MiV1 axons were located in dorsal and ventral mlfv, respectively.
Figure 5.
Figure 5.
Ipsilateral connections from the Mauthner cell to MiD cells in r5 and r6. Synaptic responses evoked in MiD cells by the ipsilateral M-cell firing. AD, Intra-axonal activation of AP in the ipsilateral M-cell axon, as exemplified in the lower trace of A, and the timing of AP peak, represented by arrows (same in the following Figs. 5–8), produced a small hyperpolarization (red) in MiD2cm with Erest of −81 mV (A), in MiD3cm at −87 mV (B), in MiD2i at −77 mV (C), and in MiD3i at −74 mV (D). The intensities of the injected currents were increased by 5 nA, except for A wherein the currents were +8, +5, 0, −5, −10, −15, and −20 nA, and the range was denoted in nanoamperes for each cell. Note that artifact potentials caused by injecting currents into the M-axon for activation, appeared in the response traces (e.g., asterisk in A) before the spike of the M-axon (arrow) in most of the traces in Figures 5–8. IPSPs were blocked by applying strychnine on the remaining slow depolarizations in the MiD3cm cell (B, bottom trace). In some MiD2i and MiD3i cells, sharp depolarizations were observed before IPSPs, as exemplified in the lower traces of C and D at Erest of −77 mV and −91 mV, respectively (upper and bottom traces were obtained in different cells in D). Amplitudes of these potentials were insensitive to the polarization of the recorded cells. E, F, Bar graphs quantifying PSP amplitudes and peak times from the onset at Erest; **p < 0.01, *p < 0.05; n.s., Not significant. G, All MiD cells showed a small long-lasting depolarization (>200 ms) after initial hyperpolarization. The calibration in A is also applicable to top traces in BD.
Figure 6.
Figure 6.
Contralateral connections from the Mauthner cell to MiD cells in r5 and r6. An AP of the M-cell produced long-lasting depolarization in MiD cells on the contralateral side, whereas short hyperpolarization preceded the depolarization only in MiD2cm, with Erest of −80 mV for MiD2cm (A), −78 mV for MiD3cm (B), −83 mV for MiD2i (C), and −75 mV for MiD3i (D), respectively. Depolarizations evoked in MiD2i and MiD3i were similar in shape. The initial hyperpolarizing response observed in MiD2cm cell was changed in amplitude and reversed in polarity when the cell was polarized (−20, −15, −10, −5, +5, +8 nA; A, bottom). Red trace is the response at Erest. The calibration for top trace of A is applicable to BD. E, F, Bar graphs quantifying PSP amplitudes and peak times from the onset at Erest; **p < 0.01, *p < 0.05; n.s., Not significant.
Figure 7.
Figure 7.
Subtypes of MiM1 cells receiving different inputs from the Mauthner cell. Postsynaptic responses were elicited in bilateral MiM1D and MiM1V cells by the M-cell firing. An AP of the M-cell (arrows) produced hyperpolarization, followed by depolarization with Erest of −80 mV (red) in an ipsilateral MiM1D (A), whereas only depolarization was produced in a contralateral MiM1D cell at Erest of −79 mV (B). The initial hyperpolarizing response observed in MiM1D cells was sensitive to the currents passing through the micropipette (−25, −20, −15, −10, −5, +5, +10 nA). C, D, Initial depolarizations at Erest of −74 mV were bilaterally recorded in MiM1V cells. The calibration in A is also applicable to BD.
Figure 8.
Figure 8.
Strong excitatory outputs from the Mauthner cell to bilateral MiV cells in r4–r6. AF, Activation of the M-cell (arrows) produced strong depolarizing responses with spiking in bilateral MiV1, MiV2, and MiV3 cells (A, C, E, ipsilateral; B, D, F, contralateral). Action potentials were followed by hyperpolarization in bilateral MiV1 (A, B, insets; calibration of 5 mV) and MiV3 cells, whereas long-lasting depolarizations were observed in bilateral MiV2 cells. Erest were as follows: A, −71 mV; B, −82 mV; C, −73 mV; D, −76 mV; E, −74 mV; F, −81 mV. Underlying depolarizing potentials were shown by hyperpolarizing the cell (−5 nA) in bottom traces of C and D. The calibration in F is also applicable to AE.
Figure 9.
Figure 9.
Effects of the Mauthner cell spiking on the bursting of bilateral MiD and MiV cells. A, Repetitive firings of an MiD3cm induced by injecting depolarizing current (top trace, +22 nA) were temporally suppressed (bottom trace) after spiking of the ipsilateral M-cell (arrow). B, Raster plots showing the timing of the spikes in the MiD3cm cell shown in A without (white) and with (gray) the M-cell spike elicited at 0 ms. C, Durations of inhibition (ms) plotted against the base line firing rate (Hz; mean ± SD). The numbers of responses were 18–43 in ipsilateral MiD2cm, 17–40 in ipsilateral MiD3cm, 17–28 in ipsilateral MiD2i, 16–19 in ipsilateral MiD3i, and 12–22 in contralateral MiD2cm. D, Peristimulus time histograms (PSTHs) showing the averaged frequency of each spike of an MiD3cm cell on the ipsilateral side and an MiD3i cell on the contralateral side in response to the M-cell spike elicited at 0 ms (bin size was 5 ms). Firings of the ipsilateral MiD3cm cell was temporally stopped and enhanced later by a single spike of the M-cell (40 responses), whereas transient activation was elicited in the contralateral MiD3i cell (27 responses). E, Firing of an MiV2 cell was strongly enhanced after a single spike of the ipsilateral M-cell (arrow). F, PSTH represents the average frequency of AP of an ipsilateral MiV2 cell (bin size was 5 ms, 14 responses) in response to the M-cell spike at 0 ms. G, Firings of an MiV3 cell was instantaneously enhanced when the contralateral M-cell was fired (arrow), followed by a long-lasting suppression of activity. H, Raster plots (left) showing the effects of the M-cell firing (red arrowheads in gray area) on an ipsilateral MiV3. Transient enhancements and the following suppression of spiking were observed after the M-cell firing was applied at any phase of the MiV3 firing elicited by injected step depolarizing currents (bottom). Instantaneous change in the firing frequency of the MiV3 cell for each response (right) is shown in a different color.
Figure 10.
Figure 10.
No inputs from reticulospinal neurons to the Mauthner cell. A, Single (Aa) or multiple (Ab) spikes of MiD3cm cells (bottom) induced by injecting step depolarizing currents did not elicit any apparent bilateral potential responses in the M-cell axons (top: left, ipsilateral; right, contralateral). B, No synaptic response was observed in the soma of the M-cell after single (Ba) or multiple (Bb) spiking of a contralateral MiD2i cell.
Figure 11.
Figure 11.
Escape circuitry from the Mauthner cell to reticulospinal neurons constructed in r4–r6. A, Schematic representation of the circuits from the left M-cell to dorsally (left) and ventrally located (right) RSNs. The output of the M-cell was excitatory (possibly cholinergic, red), presumably, MiD2cm and MiD3cm cells were glycinergic (blue), and MiM1D, MiDi, and MiV cells were glutamatergic (green). Presumable interneurons between the M-cell and RSNs are represented as open (excitatory) and filled (inhibitory) symbols. + and −: excitatory and inhibitory synapse, respectively. B, Goldfish escape behavior. Silhouettes of C-bend at Stage 1 and subsequent propelling to various directions at Stage 2. C, Time course of effects of an M-cell firing on the RSNs represented on phases of C-start. The C-bend initiates ∼8 ms after the M-cell activation but here, the timing of both M-cell spike and the C-bend initiation are set at 0 ms. Excitations are denoted in pink and inhibitions in blue. The duration of asymmetrical outputs from MiD cells corresponded to the Stage 1 of escape, whereas that of symmetrical outputs from MiV cells lasted until Stage 2.

References

    1. Ahrens MB, Li JM, Orger MB, Robson DN, Schier AF, Engert F, Portugues R. Brain-wide neuronal dynamics during motor adaptation in zebrafish. Nature. 2012;485:471–477. doi: 10.1038/nature11057. - DOI - PMC - PubMed
    1. Ahrens MB, Orger MB, Robson DN, Li JM, Keller PJ. Whole-brain functional imaging at cellular resolution using light-sheet microscopy. Nat Methods. 2013;10:413–420. doi: 10.1038/nmeth.2434. - DOI - PubMed
    1. Arber S. Motor circuits in action: specification, connectivity, and function. Neuron. 2012;74:975–989. doi: 10.1016/j.neuron.2012.05.011. - DOI - PubMed
    1. Barreiro-Iglesias A, Mysiak KS, Adrio F, Rodicio MC, Becker CG, Becker T, Anadón R. Distribution of glycinergic neurons in the brain of glycine transporter-2 Tg (glyt2:gfp) transgenic adult zebrafish: relation with brain-spinal descending systems. J Comp Neurol. 2013;521:389–425. doi: 10.1002/cne.23179. - DOI - PubMed
    1. Bartelmez GW. Mauthner's cell and the nucleus motorius tegmenti. J Comp Neurol. 1915;25:87–128. doi: 10.1002/cne.900250105. - DOI

Publication types

LinkOut - more resources