. 2014 Feb 26;34(9):3364-77.
doi: 10.1523/JNEUROSCI.2734-13.2014.

Global optogenetic activation of inhibitory interneurons during epileptiform activity

Affiliations

Global optogenetic activation of inhibitory interneurons during epileptiform activity

Marco Ledri et al. J Neurosci. .

Abstract

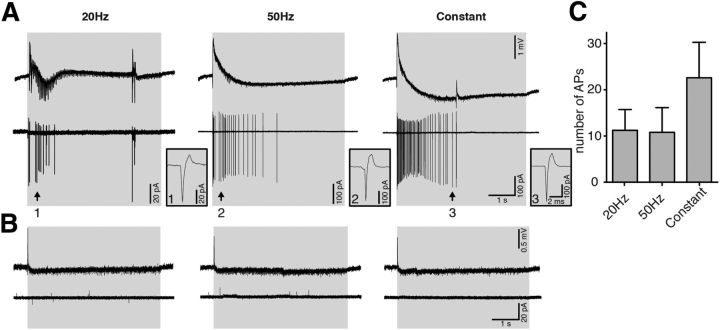
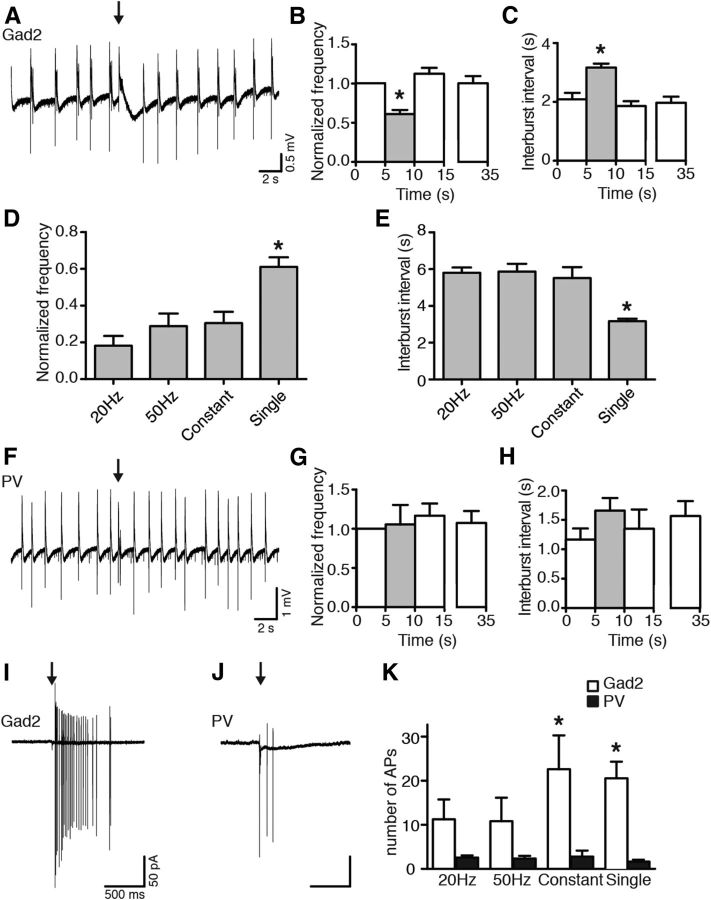
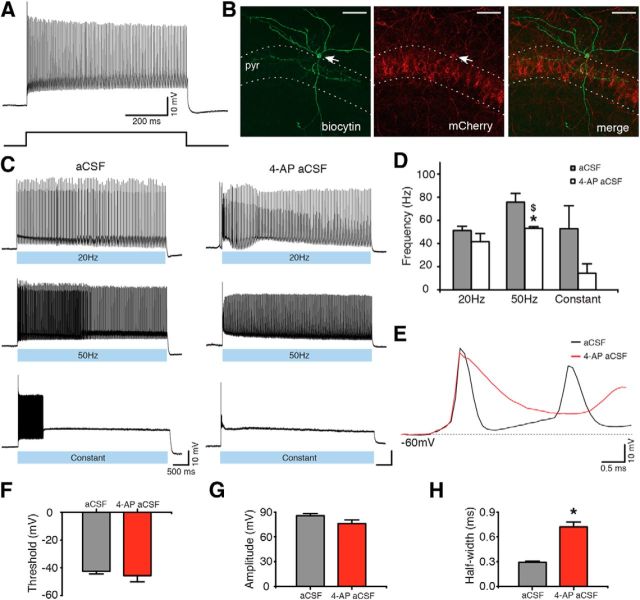
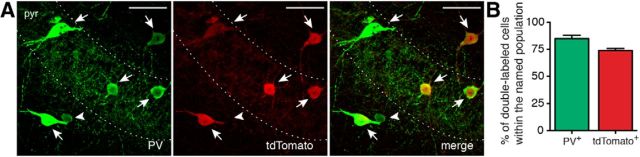
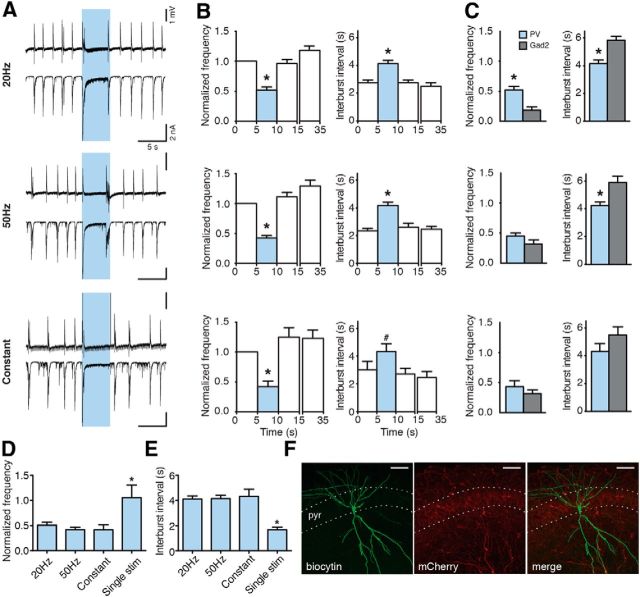
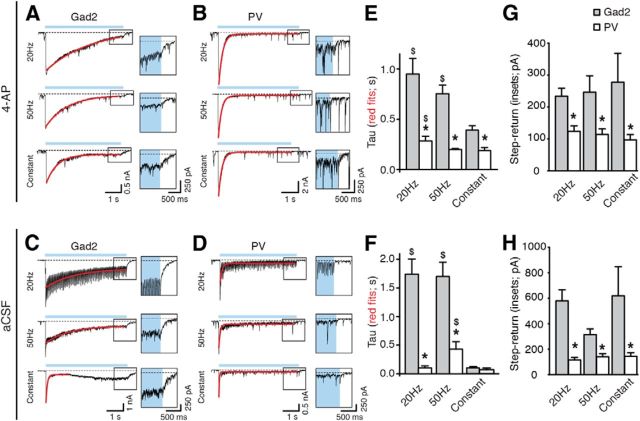
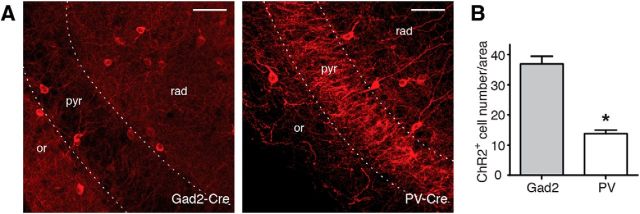
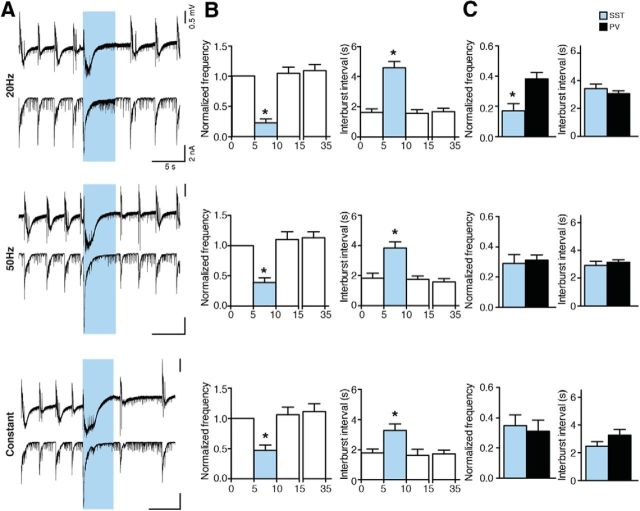
Optogenetic techniques provide powerful tools for bidirectional control of neuronal activity and investigating alterations occurring in excitability disorders, such as epilepsy. In particular, the possibility to specifically activate by light-determined interneuron populations expressing channelrhodopsin-2 provides an unprecedented opportunity of exploring their contribution to physiological and pathological network activity. There are several subclasses of interneurons in cortical areas with different functional connectivity to the principal neurons (e.g., targeting their perisomatic or dendritic compartments). Therefore, one could optogenetically activate specific or a mixed population of interneurons and dissect their selective or concerted inhibitory action on principal cells. We chose to explore a conceptually novel strategy involving simultaneous activation of mixed populations of interneurons by optogenetics and study their impact on ongoing epileptiform activity in mouse acute hippocampal slices. Here we demonstrate that such approach results in a brief initial action potential discharge in CA3 pyramidal neurons, followed by prolonged suppression of ongoing epileptiform activity during light exposure. Such sequence of events was caused by massive light-induced release of GABA from ChR2-expressing interneurons. The inhibition of epileptiform activity was less pronounced if only parvalbumin- or somatostatin-expressing interneurons were activated by light. Our data suggest that global optogenetic activation of mixed interneuron populations is a more effective approach for development of novel therapeutic strategies for epilepsy, but the initial action potential generation in principal neurons needs to be taken in consideration.

Keywords: channelrhodopsin-2; epileptiform activity; hippocampus; interneurons; optogenetics.


Figures

Figure 1.
Figure 1.
Gad2 interneurons encompass several subpopulations of inhibitory cells. A–L, Confocal stacks of slices from Gad-Cre::Ai14 mice immunostained against tdTomato (A, D, G, J) and PV (B), CCK (E), NPY (H), and SST (K). Merged images are shown in C, F, I, and L, respectively. Arrows indicate cells double-labeled for respective markers and tdTomato. A, B, Arrowhead indicates a cell positive for PV but negative for tdTomato. Scale bars, 50 μm. pyr, Stratum pyramidale; rad, stratum radiatum; luc, stratum lucidum. M, Bar graph showing the percentage of cells positive for the respective marker out of the total number of tdTomato cells in the CA3 area of the hippocampus. N, Bar graph showing the percentage of double-labeled cells (respective marker and tdTomato) within the total number of PV, CCK, NPY, and SST cells. M, N, Data were obtained from total of 15 slices from 2 animals for each marker (total number of tdTomato-positive cells, n = 10,473). O, Schematic illustration indicating the locations and subcellular targets of inhibitory interneurons expressing the markers used. 1a and 2, basket cells; 1b, axo-axonic or chandelier cell; 3, bistratified cell; 4, Schaffer-collateral associated cell; 5, neurogliaform cell; 6, ivy cell; 7, oriens-lacunosum moleculare cell. Blue represents PV; green, CCK; yellow, NPY; red, SST. Values represent mean ± SEM.
Figure 2.
Figure 2.
ChR2-expressing Gad2 interneurons generate APs upon blue light illumination. A, Whole-cell current-clamp recording (top) of a Gad2 interneuron generating a train of APs upon sustained 500 pA current injection (bottom). B, Confocal stack image showing biocytin (left) and mCherry (middle) staining of the Gad2 interneuron shown in A. Merged image is shown on the right. Scale bars, 50 μm. pyr, Stratum pyramidale. C, Same cell as in A generating APs during 20 Hz, 50 Hz, or constant blue light illumination for 5 s, in aCSF (left) and in 4-AP aCSF (right). D, Bar chart of average data from experiments shown in C (n = 5 cells for aCSF and n = 6 cells for 4-AP aCSF). *Statistical significance between the firing frequency in aCSF and 4-AP aCSF: Wilcoxon matched-pairs signed-ranks test (p = 0.031). $Significant difference between the firing frequency during 20 Hz and constant light illumination in 4-AP aCSF: Kruskal–Wallis test (p = 0.012), Dunn's multiple-comparison test (p < 0.05). E, First APs induced by 20 Hz blue light illumination in aCSF (black) and in 4-AP aCSF (red). F–H, Average parameters of the first APs induced by 20 Hz blue light illumination in the presence of aCSF (gray bar, n = 6 cells) or 4-AP aCSF (red bar, n = 6 cells). *Statistical significance between the two experimental conditions: paired t test. F, AP threshold (p = 0.216). G, AP amplitude (p = 0.110). H, AP half-width (p = 0.012). Values represent mean ± SEM.
Figure 3.
Figure 3.
Activation of Gad2 interneurons by blue light illumination inhibits epileptiform activity. A, Representative traces of field recordings from the CA3 region (top) and simultaneous whole-cell recordings from CA3 pyramidal neurons (bottom) showing the effect of different blue light illumination paradigms on epileptiform activity induced by 4-AP aCSF. Blue shading represents the period of light illumination. B, C, Bar chart of average data from respective experiments (n = 51 illuminations in 20 slices for 20 Hz; n = 50 illuminations in 21 slices for 50 Hz; n = 37 illuminations in 19 slices for constant light), indicating the effect of light illumination on frequency and interburst interval. Blue bars represent the 5 s period of blue light illumination. *Statistical significance between the effect of a single pulse (1 ms) of blue light and all other illumination paradigms. &Statistical significance between the periods before (0–5 s) and immediately after (10–15 s) light. Friedman test (p < 0.0001), Dunn's multiple-comparison test (p < 0.05). Values represent mean ± SEM. D, Confocal image showing biocytin (top) and mCherry (middle) staining of a CA3 pyramidal neuron. Merged image is shown on the bottom. Scale bars, 50 μm. pyr, Stratum pyramidale. E, Synaptic currents evoked by light illumination in CA3 pyramidal cells before (control) and after PTX application. Boxes represent regions of traces that are stretched on bottom. F, Chart summarizing total of 4 experiments as shown in E. Lines represent individual experiments (n = 4).
Figure 4.
Figure 4.
Activation of Gad2 interneurons for 10 s suppresses epileptiform activity. A, Field recordings from the CA3 region (top traces) and simultaneous whole-cell patch-clamp recordings from CA3 pyramidal neurons (bottom traces) showing the effect of different 10 s blue light illumination paradigms on epileptiform activity. Blue shading represents the period of blue light illumination. B, C, Bar chart of average data from experiments presented in A. Blue bars represent the period of blue light illumination (20 Hz, n = 20 illuminations from 10 experiments; 50 Hz, n = 18 illuminations from 9 experiments; constant, n = 20 illuminations from 10 experiments). *Statistically significant difference between the light period and all nonlight periods. $Statistically significant difference between the light period and periods before (0–10 s) and 60 s after (60–70 s) light. £Statistically significant difference between light and before light (0–10 s) periods. &Statistically significant difference between periods before (0–10 s) and immediately after (20–30 s) light. B, Friedman test (p < 0.0001), Dunn's multiple-comparison test (p < 0.01). C, Friedman test (p = 0.019 and p = 0.020, for 20 Hz and constant light, respectively), followed by Dunn's multiple-comparison test (p < 0.05). Repeated-measures ANOVA (p = 0.004), Bonferroni's multiple-comparison test (p < 0.05 for 50 Hz). Values represent mean ± SEM.
Figure 5.
Figure 5.
Activation of Gad2 interneurons induces APs in CA3 pyramidal neurons. A, B, Simultaneous field (top trace) and cell-attached recordings from CA3 pyramidal neurons (bottom trace) during 20 Hz, 50 Hz, or constant blue light illumination. APs on cell-attached recordings from CA3 pyramidal neurons upon blue light illumination in 4-AP aCSF (A) but not in normal aCSF (B). Single APs indicated as 1, 2, and 3 are presented as stretched recordings in the respective boxes on the right. C, Bar chart of average data from experiments performed in 4-AP aCSF. The average number of spikes induced by 20 Hz (n = 4 cells), 50 Hz (n = 5), and constant (n = 5) blue light illumination are not significantly different between the groups (one-way ANOVA, p = 0.340). Error bars indicate SEM.
Figure 6.
Figure 6.
Brief (1 ms) light pulse-induced activation of Gad2 interneurons, but not PV interneurons, inhibits epileptiform activity. A, Field recording from the CA3 region, showing the effect of Gad2 interneuron activation with a single 1 ms blue light pulse (black arrow) on epileptiform activity. B, C, Bar charts of average data from experiments in A. Gray bars indicate the 5 s period after the blue light pulse. Data were collected from 18 postlight periods in 9 slices. *Statistical significance between the light period and all nonlight periods: one-way ANOVA (p < 0.0001), Bonferroni's multiple-comparison test (p < 0.001). D, E, Bar charts showing the average effect of different blue light illumination paradigms on epileptiform activity in Gad2-Cre mice. *Statistically different from all other illumination paradigms: Kruskal–Wallis test (p < 0.0001), Dunn's multiple-comparison test (p < 0.01). F, Field recording from the CA3 region. Activation of PV interneurons with a single 1 ms blue light pulse (black arrow) does not inhibit epileptiform activity. G, H, Average data from experiments in F (Kruskal–Wallis test, p = 0.246, in G; one-way ANOVA, p = 0.506, in H; n = 9 light periods in 5 slices). I, J, Cell-attached recordings from CA3 pyramidal neurons during 1 ms blue light pulse stimulation (black arrow) of Gad2 (I) and PV (J) interneurons. K, Average number of APs (Gad2: n = 4 for 20 Hz, n = 5 for 50 Hz, n = 5 for constant and n = 13 for single; PV: n = 16, n = 11, n = 5, and n = 6, respectively). *One-way ANOVA, p < 0.0001, Bonferroni's multiple-comparison test (p < 0.05). Values represent mean ± SEM.
Figure 7.
Figure 7.
ChR2-expressing PV interneurons generate APs upon blue light illumination. A, Whole-cell recording (top) of a PV interneuron generating typical high-frequency nonaccommodating APs upon sustained 500 pA current injection (bottom). B, Confocal image showing biocytin (left) and mCherry (middle) staining of the PV interneuron shown in A. Merged image is shown on the right. Scale bars, 50 μm. pyr, Stratum pyramidale. C, Whole-cell recordings from the cell shown in A and B illustrating APs during 20 Hz, 50 Hz, or constant blue light illumination for 5 s, in aCSF (left) and in 4-AP aCSF (right). D, Bar chart of averaged data from experiments shown in C (n = 5 in normal aCSF and n = 6 in 4-AP aCSF). *Statistically significant difference between the AP frequency in aCSF and 4-AP aCSF: paired t test (p = 0.030). $Significant difference between the firing frequency during 50 Hz versus constant light illumination paradigms in 4-AP aCSF: Kruskal–Wallis test (p = 0.003), Dunn's multiple-comparison test (p < 0.05). E, The first AP induced by 20 Hz blue light illumination in aCSF (black) and in 4-AP aCSF (red). F–H, Average characteristics of the first APs induced by 20 Hz blue light illumination in the presence of aCSF (gray bar, n = 5) or 4-AP aCSF (red bar, n = 5). *Statistically significant difference between the two experimental conditions: paired t test. F, Average AP threshold (p = 0.105). G, Average AP amplitude (p = 0.444). H, Average AP half-width (p = 0.001). Values represent mean ± SEM.
Figure 8.
Figure 8.
Cre is selectively expressed in PV interneurons in PV-Cre mice. A, Confocal image showing immunostaining for PV (left) and tdTomato (middle) in PV-Cre::Ai14 mice. Right, Merge image. Arrows indicate cells double-labeled for PV and tdTomato. Arrowhead indicates a cell positive for PV but negative for tdTomato. Scale bars, 50 μm. pyr, Stratum pyramidale. B, Bar chart indicating the average percentage of double-labeled cells in PV-Cre::Ai14 mice within the whole PV (green) or tdTomato (red) populations. Counting was performed in 15 slices from 2 animals; n = 443 total tdTomato+ cells. Error bars indicate SEM.
Figure 9.
Figure 9.
Prolonged activation of PV interneurons suppresses epileptiform activity. A, Field recordings from the CA3 region (top) and simultaneous whole-cell recordings from CA3 pyramidal neurons (bottom) showing the effect of different illumination paradigms on epileptiform activity. Blue shading represents illumination. B, Bar charts of average data (n = 61 illuminations in 25 slices for 20 Hz; n = 66 illuminations in 27 slices for 50 Hz; n = 17 illuminations in 9 slices for constant). Blue bars represent the light period. *Statistically significant difference between the light and all nonlight periods. #Statistically significant difference between the light period and periods after (10–15 and 30–35 s) light. Friedman test (p < 0.0001), Dunn's multiple-comparison test (p < 0.01) for all illuminations, except for constant interburst interval where repeated-measures ANOVA (p = 0.0064), Bonferroni's multiple-comparison test (p < 0.05) was used. C, Comparison between effects of illumination on bursting in Gad2-Cre versus PV-Cre mice. *Unpaired t test (p < 0.0001) for 20 Hz. Unpaired t test with Welch's correction (p = 0.0008) for 50 Hz. D, E, Bar charts comparing the effect of different illumination paradigms activating PV interneurons on epileptiform activity. *Statistical significance between the effect of a single light pulse and all other illumination paradigms. Kruskal–Wallis test (p = 0.015) and Dunn's multiple-comparison test (p < 0.05) for normalized frequency. Kruskal–Wallis test (p = 0.002) and Dunn's multiple-comparison test (p < 0.01) for interburst interval. Values represent mean ± SEM. F, Confocal image showing biocytin (left) and mCherry (middle) immunostaining of a CA3 pyramidal neuron. Merged image is on the right. Scale bars, 50 μm. pyr, Stratum pyramidale.
Figure 10.
Figure 10.
Longer decay time of light-induced currents in CA3 pyramidal cells in Gad2 compared with PV mice. A–D, Whole-cell recordings of CA3 pyramidal neurons in 4-AP ACSF (A, B) or normal aCSF (C,D), showing the inward current induced by light activation of Gad2 (A, C) or PV (B,D) interneurons. Blue line indicates the period of light illumination. Dashed line indicates the baseline. Single exponential fit to the current decay is shown in red. Note the current step at blue light termination in the expanded boxes on the right. E, F, Comparison between the time constant τ of the decay for the inward current recorded in CA3 pyramidal neurons upon activation of Gad2 or PV interneurons in 4-AP aCSF (E; Gad2, n = 24 illuminations from 12 experiments; PV, n = 23 and 24 illuminations from 12 experiments for 20 and 50 Hz, n = 14 from 7 experiments for constant) or normal aCSF (F; Gad2, n = 5 illuminations from 5 experiments; PV, n = 12 illuminations from 12 experiments). *Statistically significant difference between the τ for Gad2 and PV mice. Kruskal–Wallis test (p < 0.0001), Dunn's multiple-comparison test (p < 0.01) for 4-AP aCSF. One-way ANOVA (p < 0.01), Bonferroni's multiple-comparison test (p < 0.001) for normal aCSF. $Statistically significant difference between the τ in Gad2 or PV mice during constant light versus 20 Hz or 50 Hz illumination paradigms. Kruskal–Wallis test (p < 0.05), Dunn's multiple-comparison test (p < 0.05) for 4-AP aCSF and PV-mice in aCSF. One-way ANOVA (p = 0.0002), Bonferroni's multiple-comparison test (p < 0.001) for Gad-mice in aCSF. G, H, Comparison between the step-return to baseline current recorded in CA3 pyramidal cells at the end of light stimulation, in 4-AP aCSF (G; Gad2, n = 20 illuminations from 10 experiments for 20 and 50 Hz, n = 18 illuminations from 9 experiments for constant; PV, n = 18 illuminations from 9 experiments for 20 Hz, n = 20 illuminations from 9 experiments for 50 Hz and n = 15 illuminations from 8 experiments for constant) and normal aCSF (H; Gad2, n = 5 illuminations from 5 experiments; PV, n = 12 illuminations from 12 experiments.*Statistically significant difference between the measured current after Gad2 versus PV interneuron stimulation. Mann–Whitney U test and unpaired t test for experiments performed in 4-AP and normal aCSF, respectively (p < 0.05), in all cases. Values represent mean ± SEM.
Figure 11.
Figure 11.
A higher number of interneurons express ChR2 in Gad2-Cre compared with PV-Cre mice. A, Confocal images showing immunostaining for mCherry in Gad2-Cre (left) and PV-Cre (right) mice. Scale bars, 50 μm. or, Stratum oriens; pyr, stratum pyramidale; rad, stratum radiatum. B, Bar chart showing the average number of ChR2-positive cells in the CA3 region of Gad2-Cre and PV-Cre mice. Counting was performed in 24 slices from 4 Gad2-Cre mice (n = 923 ChR2-positive cells) and 18 slices from 3 PV-Cre mice (n = 235 ChR2-positive cells). *p < 0.0001 (unpaired t test with Welch's correction). Error bars indicate SEM.
Figure 12.
Figure 12.
Activation of SST interneurons suppresses epileptiform activity. A, Field recordings from the CA3 region (top) and simultaneous whole-cell recordings from CA3 pyramidal neurons (bottom) showing the effect of different illumination paradigms on epileptiform activity. Blue shading represents illumination. B, Bar charts of averaged data (n = 18 illuminations in 9 slices for 20 Hz and 50 Hz, and n = 16 illuminations in 8 slices for constant). Blue bars represent light period. *Statistical difference between the light and all nonlight periods. Friedman test (p < 0.0001) and Dunn's multiple-comparison test (p < 0.01) for all illuminations, except for 20 Hz interburst interval where repeated-measures ANOVA (p < 0.0001) followed by Bonferroni's multiple-comparisons test (p < 0.0001 were used). C, Comparison of effects of illumination on bursting between SST- and PV-Cre mice. *p < 0.05, significant difference (unpaired t test).

Similar articles

Cited by

References

    1. Avoli M. Is epilepsy a disorder of inhibition or excitation? Prog Clin Biol Res. 1983;124:23–37. - PubMed
    1. Avoli M, de Curtis M. GABAergic synchronization in the limbic system and its role in the generation of epileptiform activity. Prog Neurobiol. 2011;95:104–132. doi: 10.1016/j.pneurobio.2011.07.003. - DOI - PMC - PubMed
    1. Avoli M, D'Antuono M, Louvel J, Köhling R, Biagini G, Pumain R, D'Arcangelo G, Tancredi V. Network and pharmacological mechanisms leading to epileptiform synchronization in the limbic system in vitro. Prog Neurobiol. 2002;68:167–207. doi: 10.1016/S0301-0082(02)00077-1. - DOI - PubMed
    1. Barmashenko G, Hefft S, Aertsen A, Kirschstein T, Köhling R. Positive shifts of the GABAA receptor reversal potential due to altered chloride homeostasis is widespread after status epilepticus. Epilepsia. 2011;52:1570–1578. doi: 10.1111/j.1528-1167.2011.03247.x. - DOI - PubMed
    1. Boyden ES, Zhang F, Bamberg E, Nagel G, Deisseroth K. Millisecond-timescale, genetically targeted optical control of neural activity. Nat Neurosci. 2005;8:1263–1268. doi: 10.1038/nn1525. - DOI - PubMed

Publication types

MeSH terms