. 2014 Feb 26;34(9):3378-89.
doi: 10.1523/JNEUROSCI.4384-13.2014.

Sprouting of brainstem-spinal tracts in response to unilateral motor cortex stroke in mice

Affiliations

Sprouting of brainstem-spinal tracts in response to unilateral motor cortex stroke in mice

Lukas C Bachmann et al. J Neurosci. .

Abstract

After a stroke to the motor cortex, sprouting of spared contralateral corticospinal fibers into the affected hemicord is one mechanism thought to mediate functional recovery. Little is known, however, about the role of the phylogenetically old, functionally very important brainstem-spinal systems. Adult mice were subjected to a unilateral photothrombotic stroke of the right motor cortex ablating 90% of the cross-projecting corticospinal cells. Unilateral retrograde tracing from the left cervical spinal hemicord devoid of its corticospinal input revealed widespread plastic responses in different brainstem nuclei 4 weeks after stroke. Whereas some nuclei showed no change or a decrease of their spinal projections, several parts of the medullary reticular formation as well as the spinally projecting raphe nuclei increased their projections to the cortically denervated cervical hemicord by 1.2- to 1.6-fold. The terminal density of corticobulbar fibers from the intact, contralesional cortex, which itself formed a fivefold expanded connection to the ipsilateral spinal cord, increased up to 1.6-fold specifically in these plastic, caudal medullary nuclei. A second stroke, ablating the originally spared motor cortex, resulted in the reappearance of the deficits that had partially recovered after the initial right-sided stroke, suggesting dependence of recovered function on the spared cortical hemisphere and its direct corticospinal and indirect corticobulbospinal connections.

Keywords: brainstem; plasticity; recovery; sprouting; stroke; tracing.


Figures

Figure 1.
Figure 1.
Partial recovery of proximal and distal motor functions after unilateral motor cortex stroke. A, Adult female C57BL/6 mice (n = 11) received a large unilateral photothrombotic stroke to the right hemisphere, depriving the left spinal hemicord of its main corticospinal input. Behavioral performance was tested periodically until 28 d after stroke. Animals were subsequently injected with the retrograde tracer FB and 3 d later perfused. B, Starting at 2 d until 28 d poststroke animals showed a preference to use the right paw for rearing in a cylinder. The ability to place the affected paw at the cylinder was deficient and did not recover (cylinder contacts per total amount of stand-up). C, Largely unable to stay on a rotating rod at 2 d, function gradually returned throughout the testing period. From 7 d onward, performance stabilized at intermediate levels. D, Climbing up a rope requires forceful, controlled use of the distal and proximal fore and hindlimbs (drawing). Because of an initial paresis of the left forelimb, climbing ability was impaired. This is reflected in a deficient climbing speed. Function gradually recovered, entering a functional plateau between 14 and 28 d. E, The number of correct, first attempt steps with the left paw on the grid remained deficient, showing only limited recovery until 28 d. When slipping through the mesh (drawing) at later time-points (i.e., 14 d onward), in contrast to the initial time after stroke, animals quickly retracted and adjusted the limb position (not quantified observation). Repeated-measures one-way ANOVA for 2 d to 28 d, no post hoc testing; n = 11.
Figure 2.
Figure 2.
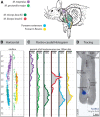
Motoneurons (MN) supplying proximal and distal forelimb muscles are located throughout the cervical enlargement. A, Proximal (M. trapezius, M. pectoralis major), upper arm (M. triceps brachii, M. biceps brachii), and lower arm muscles (paw flexors and extensors) were injected with FB (n = 2 animals, per muscle). B, MN distribution along the rostrocaudal length of the spinal cord was mapped (composite view). C, M. trapezius MNs were most abundant in the rostral (C1–C5) spinal cord. M. pectoralis MNs spanned the whole length of the cervical spinal cord (medial and lateral cell column). M. biceps brachii MNs were mainly located in segments C4 and C5. M. trapezius and the lower arm muscle MNs were distributed in the C6–T1 segments. C, Data are shown as percentage of total MN counted per muscle group per 100 μm rostrocaudal bin. D, Cervical segments C6–C7 (i.e., vertebral segment C6) was chosen as the site of retrograde tracer (FB) injection to assess the plasticity of spinal projecting systems important for lower forelimb motor control. Horizontal spinal cord section (bright-field, gray) superimposed with FB fluorescent signal (blue).
Figure 3.
Figure 3.
Anatomy of corticospinal and brainstem–spinal projections and their differential plastic reactions to stroke. A, B, Intact animals (n = 9) and animals that had recovered for 4 weeks after stroke (chronic, n = 8) were injected with the retrograde tracer FB in the stroke-affected, left hemicord at spinal segment C6–C7. All FB-containing neurons were digitally reconstructed into a 3D mouse brain model. To correct for minor individual variance in tracing efficiency, cell counts were normalized (normalization factor: lower left corner). C–E, Average cell distribution maps show the number of cells per individual 100 × 100 μm voxels (average of all animals per group; dimension orthogonal to the plain of view is collapsed). Difference maps represent the difference of cell numbers per individual 100 × 100 μm voxel projection between intact and chronic stroke animals. In difference maps, cold colors represent a decrease; warm colors represent an increase of labeled cell bodies from the intact to the chronic group. E, I–VI, Coronal projections show the cell distribution in five rostrocaudal segments (C,D). C, Maps represent the prominent loss of cells in the lesioned cortex that had projections to the contralesional spinal cord at spinal level C6–C7 (blue in difference map). Two prominent plastic hotspots are seen in the brainstem: one just rostral to the inferior olive (segment V) in the ventral medulla and one more caudally, ∼500 μm more dorsal (segment VI). In the dorsal aspects of the caudal medulla oblongata, a decrease of FB containing neurons is indicated (segment VI). D, Comparing intact and chronic animals reveals that the rostral forelimb area was partially spared. A widespread sprouting response of cortical cells, contralateral to the stroke, was seen (segments I and II). These cells, with a de novo ipsilateral projection, appeared as mirrored image of the intact primary motor cortex. In the medullary brainstem, the two plastic hotspots (C) are seen primarily on the left side, contralateral to the stroke. At the midline, the raphe nuclei contain more cells projecting into the stroke-affected hemicord after stroke (segment V). E, A detailed view of the rostrocaudal segments I-VI reveals an increase of cells in the secondary sensory cortex (segment II) and in the left, contralateral, lateral vestibular nucleus (segment V) after stroke (C, internal group variability). Distribution of individual animals in both groups relative to the group mean are comparable, showing that average cell distribution maps are not dominated by statistical outliers in either group. This is illustrated by the cell counts per 500 μm rostrocaudal segment for each animal, which are expressed as z-score (i.e., cell count = group mean + z-score × SD of all animals within the corresponding group; see Materials and Methods).
Figure 4.
Figure 4.
Quantification of projection changes of cortex and upper brainstem to the stroke-affected spinal hemicord. Eleven separate cortical (A–C) and subcortical (C–E) regions projecting to segments C6–C7 of the stroke-affected hemicord were analyzed in intact (gray bars) and chronic stroke (white bars) animals. F–R, Left and right sides of the brain were analyzed separately (i.e., left being contralateral to the stroke, but ipsilateral to the deficient forepaw and the tracer injection). F, The stroke spared only 10% of the sensory motor cortex on the ipsilesional hemisphere (G) because of a ∼50% sparing of the rostral forelimb area (RFA). A significant number of de novo left cervical spinal projections originate from the unlesioned cortical hemisphere (F, total), in particular from the rostral part of the main forelimb projecting area (H; M1 FLr) along with a considerable population in the RFA (G). De novo projections from the caudal portion of the main forelimb projecting area (I, M1 FLc) did not form consistently in all animals. J, De novo projections from the main hindlimb projecting cortex (M1 HL) increased significantly, but not consistently, in all animals (J, left, individual data points). K, The corticospinal projections from the right secondary sensory cortex (S2), being spared by the stroke, also increased. L–R, In the diencephalon, mesencephalon, and pons, there were no areas significantly strengthening their projections into the left hemicord. Several of these regions displayed a slight (i.e., to 60–80% of control) decrease of left spinal projecting neurons. M, The red nucleus, functionally closely related to the cortex, showed no stroke-induced changes of projections. F–K, Insets, Left cell counts enlarged for better visibility. F–R, p.o.c., Percentage of control (i.e., chronic as % of intact); abs.diff., absolute difference (i.e., [chronic] − [intact]). Unpaired, two-tailed t test: intact (n = 9) versus chronic (n = 8). *p < 0.05. **p < 0.01. ***p < 0.001.
Figure 5.
Figure 5.
Quantification of projection changes of the cerebellar and lower brainstem nuclei. Fifteen separate C6–C7-projecting areas in the cerebellum, the rostral medulla oblongata (A), and the caudal medulla (B) were analyzed in intact (gray bars) and chronic stroke (white bars) animals (C–R) (right side ipsilateral to the stroke). C, The serotonergic raphe nuclei (i.e., raphe obscurus, pallidus, and magnus) located on both sides immediately at the sagittal midline increased their projection into the left (i.e., stroke-affected hemicord). D, E, Unchanged, weak projections from the deep cerebellum. F, The left, lateral, but not the medial (G), vestibular ncl. showed increased retrograde labeling in chronic animals. H, Cell counts decrease in Ncl. reticularis parvocellularis after stroke. I–M, The most numerous de novo projections into the left C6–C7 spinal hemicord were found from the Ncl. reticularis gigantocellularis (I; NRGi), in particular, from the ventral aspects of the nucleus (K; NRGiV, including Ncl. ret. magnocellularis or gigantocellularis pars α). The more dorsal, intermediate NRGi showed a tendency (see p values) to a similar, ∼1.3-fold increase (J; NRGiM). L, The right, lateral gigantocellular ncl. (including the lateral paragigantocellular ncl.) tended to increase its left spinal projections by 1.6-fold (p = 0.0507). M, Only a decrease in the spinal projection was present in the dorsal aspects of NRGiD. N, O, Some plasticity was seen in the oral part of the spinal trigeminal nucleus. P–R, In the caudal, medullary reticular formation, the considerably fewer C6–C7-projecting cells were found in the dorsal aspects in chronic animals (P). The ventral medullary ret. ncl., like the more rostral ventral ret. ncll., significantly strengthened its left spinal projections (Q). The ipsilesional ncl. retroambiguus doubled its C6–C7 projection. C–R, p.o.c., Percentage of control (i.e., chronic as % of intact); abs.diff., absolute difference (i.e., [chronic] − [intact]). Unpaired, two-tailed t test: intact (n = 9) versus chronic (n = 8). Not significant (but p < 0.1). *p < 0.05. **p < 0.01. ***p < 0.001.
Figure 6.
Figure 6.
Plastic changes of corticobulbar projections from the spared, contralesional cortex. A, Horizontal distribution map of C6–C7-projecting cells (same as Fig. 3D; segments V, VI; chronic animals) with superimposed corticobulbar varicosities. B, Coronal distribution map of C6–C7-projecting cells (Fig. 3E; combined segments V, VI; chronic animals). C, D, Horizontal and coronal density map of corticobulbar terminals shows strengthening of corticoreticular and corticoraphe projections from the contralesional motor cortex to the left, ipsilateral brainstem. Areas of increased innervation correlate with the strongly spinal projecting areas (A, B). E, Automated varicosity counts are normalized to the total number of traced fibers in the pyramidal decussation. Groups have comparable tracings and normalization factors. F, G, A significant, 1.5- to 1.7-fold increase of corticobulbar varicosities is seen in the left ventral Ncl. ret. gigantocellularis (i.e., including Ncl. ret. magnocellularis or gigantocellularis pars α) and the raphe nuclei on the sagittal midline (i.e., raphe obscurus, pallidus, and magnus). Unpaired, two-tailed t test: intact (n = 8) versus chronic (n = 7). *p < 0.05. **p < 0.01.
Figure 7.
Figure 7.
Recovery of function is dependent on the intact, contralateral cortex as shown by sequential, bilateral motor cortex stroke. A, Animals received a one-sided photothrombotic stroke (right, stroke 1), were allowed to recover for 4 weeks and then given a second stroke (left, stroke 2) leading to a complete, bilateral ablation of the primary motor cortex. B–E, Behavior was assessed before (baseline [BL]) and after the first stroke (2 d) and before (28 d) and after the second stroke (2, 4, 7 d S2). Dotted, horizontal line indicates mean performance at BL and 2 d. Dashed vertical line indicates time of stroke 2. B, Having partially recovered the ability to stay on a rotating rod performance is heavily deficient after the second stroke and remains deficient for all but one animal (see individual data points). C, Rearing asymmetry in the cylinder changed back to a symmetrical behavior because of the now bilaterally deficient paw placement ability. The ability to place the left (i.e., affected by stroke 1) forelimb to the cylinder wall was almost fully deficient initially after the second stroke (likewise the right paw; data not shown). Placing of the paws to the cylinder wall returned 4 d after stroke 2, whereby the firm placement of the paw was switched to a compensatory pawing/digging movement at the cylinder wall (data not shown). D, Rope climbing speed was strongly deficient after stroke 2, whereby function returned later on. E, Functional stepping on the grid, having recovered only poorly after stroke 1, was minimally affected by stroke 2. Repeated-measures one-way ANOVA, post hoc testing: Dunnett's multiple comparison to 28 d; n = 4. *p < 0.05. **p < 0.01. ***p < 0.001.

References

    1. Bach LM, Magoun HW. The vestibular nuclei as an excitatory mechanism for the cord. J Neurophysiol. 1947;10:331–337. - PubMed
    1. Bácskai T, Fu Y, Sengul G, Rusznák Z, Paxinos G, Watson C. Musculotopic organization of the motor neurons supplying forelimb and shoulder girdle muscles in the mouse. Brain Struct Funct. 2013;218:221–238. doi: 10.1007/s00429-012-0396-3. - DOI - PubMed
    1. Baker SN. The primate reticulospinal tract, hand function and functional recovery. J Physiol. 2011;589:5603–5612. doi: 10.1113/jphysiol.2011.215160. - DOI - PMC - PubMed
    1. Benecke R, Meyer BU, Freund HJ. Reorganisation of descending motor pathways in patients after hemispherectomy and severe hemispheric lesions demonstrated by magnetic brain stimulation. Exp Brain Res. 1991;83:419–426. - PubMed
    1. Berridge KC. Progressive degradation of serial grooming chains by descending decerebration. Behav Brain Res. 1989;33:241–253. doi: 10.1016/S0166-4328(89)80119-6. - DOI - PubMed

Publication types

MeSH terms