. 2014 May 1;306(9):F996-1007.
doi: 10.1152/ajprenal.00657.2013. Epub 2014 Feb 26.

Increasing cGMP-dependent protein kinase activity attenuates unilateral ureteral obstruction-induced renal fibrosis

Affiliations

Increasing cGMP-dependent protein kinase activity attenuates unilateral ureteral obstruction-induced renal fibrosis

Wenpeng Cui et al. Am J Physiol Renal Physiol. .

Abstract

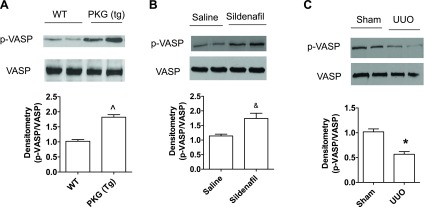
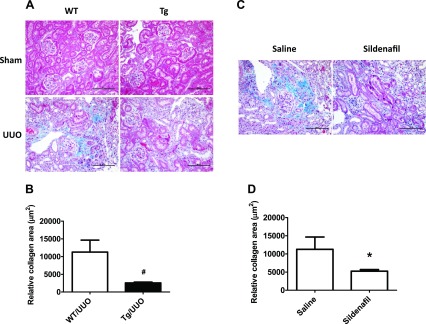
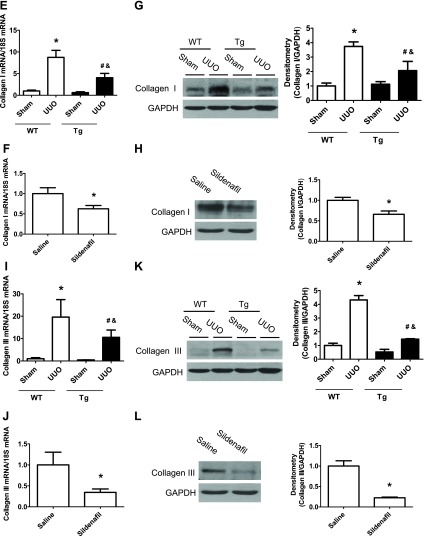
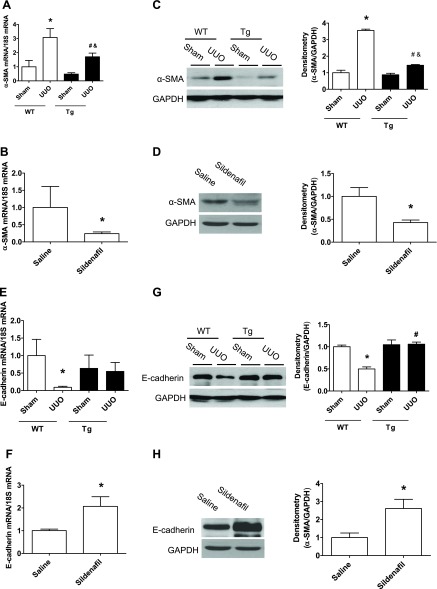
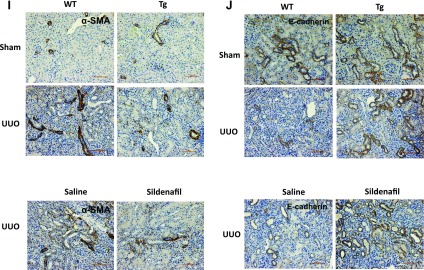
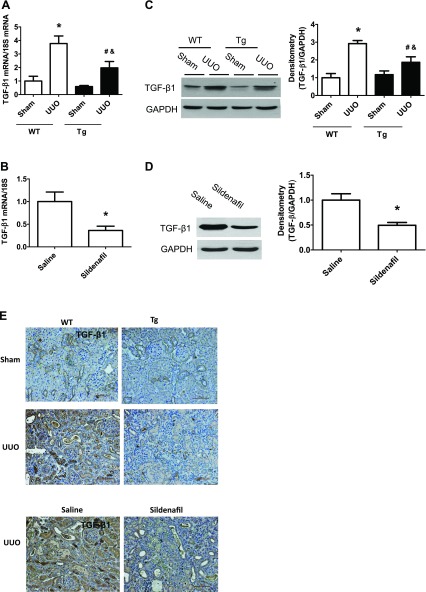
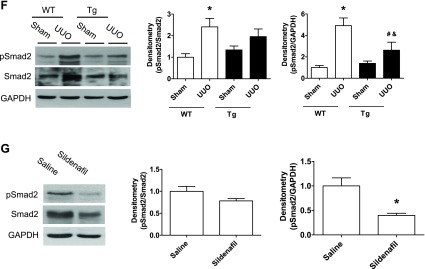
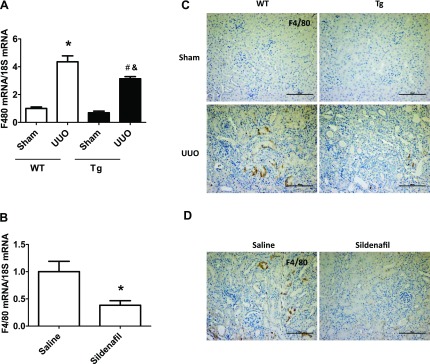
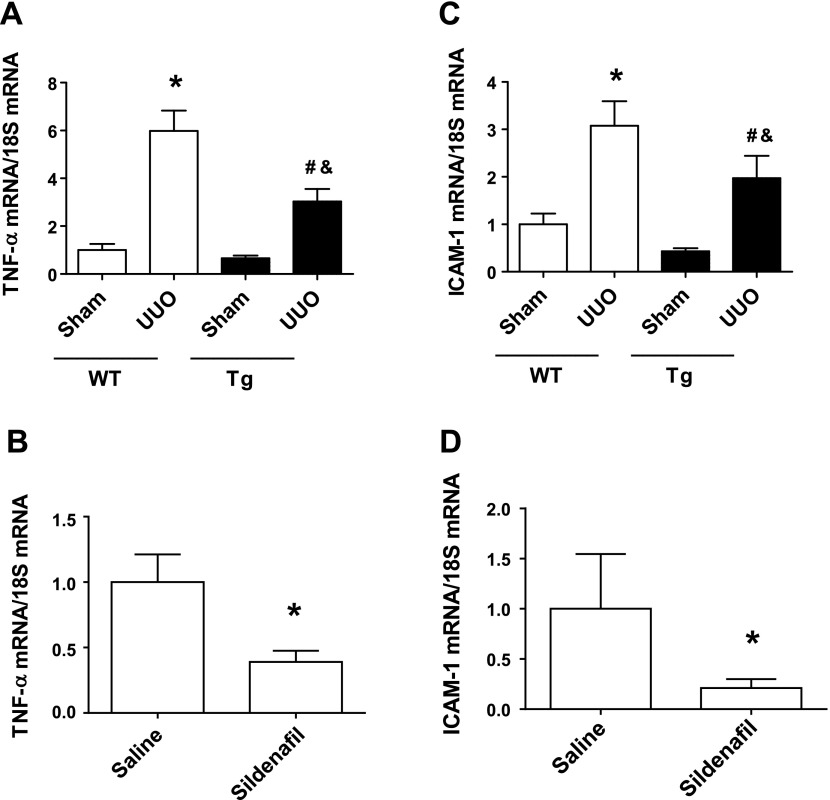
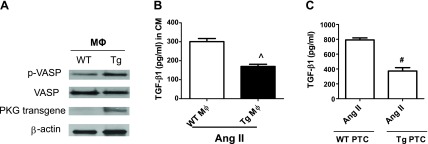
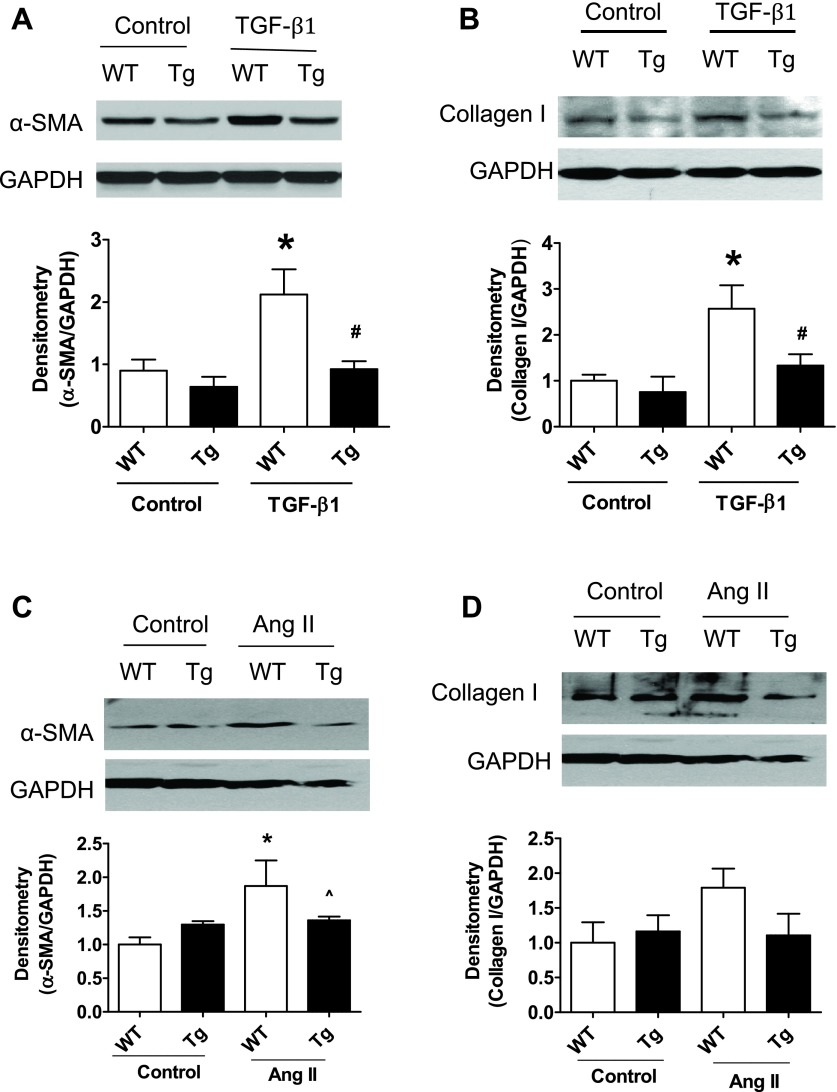
Our previous studies support the protective effect of cGMP and cGMP-dependent protein kinase I (PKG-I) pathway on the development of renal fibrosis. Therefore, in the present studies, we determined whether pharmacologically or genetically increased PKG activity attenuates renal fibrosis in a unilateral ureteral obstruction (UUO) model and also examined the mechanisms involved. To increase PKG activity, we used the phosphodiesterase 5 inhibitor sildenafil and PKG transgenic mice. UUO model was induced in wild-type or PKG-I transgenic mice by ligating the left lateral ureteral and the renal fibrosis was observed after 14 days of ligation. Sildenafil was administered into wild-type UUO mice for 14 days. In vitro, macrophage and proximal tubular cell function was also analyzed. We found that sildenafil treatment or PKG transgenic mice had significantly reduced UUO-induced renal fibrosis, which was associated with reduced TGF-β signaling and reduced macrophage infiltration into kidney interstitial. In vitro data further demonstrated that both macrophages and proximal tubular cells were important sources of UUO-induced renal TGF-β levels. The interaction between macrophages and tubular cells contributes to TGF-β-induced renal fibrosis. Taken together, these data suggest that increasing PKG activity ameliorates renal fibrosis in part through regulation of macrophage and tubular cell function, leading to reduced TGF-β-induced fibrosis.

Keywords: PKG; TGF-β1; UUO; renal fibrosis.


Figures

Fig. 1.
Fig. 1.
Changes of cGMP-dependent protein kinase I (PKG) activity in the kidneys from unilateral ureteral obstruction (UUO) mouse model. Representative immunoblotting of p-vasodilator-stimulated phosphoprotein (VASP) and total VASP in kidney cortex from wild-type (WT) or PKG transgenic (Tg) mice (A), from saline- or sildenafil-treated mice (B), or from WT mice after 14 days of UUO or sham surgery (C). Data are presented as means ± SE (n = 4 mice/group). *P < 0.05 vs. WT/sham group. ^P < 0.05 vs. WT mice. &P < 0.05 from saline-treated mice.
Fig. 2.
Fig. 2.
Increasing PKG activity attenuates renal fibrosis in a UUO mouse model. Representative light photomicrograph of the Masson staining of the kidney sections from 4 groups of WT and PKG-I Tg mice after 14 days of UUO or sham surgery (A) or from 2 groups of saline- and sildenafil-treated UUO mice (C). The positive collagen staining was shown as blue color. The scale bar represents 100 μm. Semiquantitative analysis was performed by calculating the positive area (B and D). Collagen type I (E–H) and collagen type III (I–L) mRNA and protein levels in kidney cortex from UUO or sham mice were determined by real-time PCR and Western blotting, respectively. Data are presented as means ± SE (n = 5–6 mice/group). *P < 0.05 vs. WT/sham group or saline group. #P < 0.05 vs. WT/UUO group. &P < 0.05 vs. Tg/sham group.
Fig. 2.
Fig. 2.
Increasing PKG activity attenuates renal fibrosis in a UUO mouse model. Representative light photomicrograph of the Masson staining of the kidney sections from 4 groups of WT and PKG-I Tg mice after 14 days of UUO or sham surgery (A) or from 2 groups of saline- and sildenafil-treated UUO mice (C). The positive collagen staining was shown as blue color. The scale bar represents 100 μm. Semiquantitative analysis was performed by calculating the positive area (B and D). Collagen type I (E–H) and collagen type III (I–L) mRNA and protein levels in kidney cortex from UUO or sham mice were determined by real-time PCR and Western blotting, respectively. Data are presented as means ± SE (n = 5–6 mice/group). *P < 0.05 vs. WT/sham group or saline group. #P < 0.05 vs. WT/UUO group. &P < 0.05 vs. Tg/sham group.
Fig. 3.
Fig. 3.
Increasing PKG activity affects kidney α-smooth muscle actin (SMA) and E-cadherin levels in a UUO mouse model. α-SMA (A–D) and E-cadherin (E–H) mRNA and protein levels in the kidney cortex from UUO or sham mice were determined by real-time PCR and Western blotting, respectively. Data are presented as means ± SE (n = 5–6 mice/group). *P < 0.05 vs. WT/sham group or saline group. #P < 0.05 vs. WT/UUO group. &P < 0.05 vs. Tg/sham group. I–J: kidney sections were stained with anti-α-SMA or E-cadherin antibody. The positive staining is shown as brown. Representative light micrographs are shown.
Fig. 3.
Fig. 3.
Increasing PKG activity affects kidney α-smooth muscle actin (SMA) and E-cadherin levels in a UUO mouse model. α-SMA (A–D) and E-cadherin (E–H) mRNA and protein levels in the kidney cortex from UUO or sham mice were determined by real-time PCR and Western blotting, respectively. Data are presented as means ± SE (n = 5–6 mice/group). *P < 0.05 vs. WT/sham group or saline group. #P < 0.05 vs. WT/UUO group. &P < 0.05 vs. Tg/sham group. I–J: kidney sections were stained with anti-α-SMA or E-cadherin antibody. The positive staining is shown as brown. Representative light micrographs are shown.
Fig. 4.
Fig. 4.
Increasing PKG activity reduced transforming growth factor (TGF)-β/Smad pathway in a UUO mouse model. A–D: kidney TGF-β1 mRNA and protein levels from UUO or sham group of mice were determined by real-time PCR and Western blotting, respectively. E: kidney sections from mice were stained with anti-TGF-β1 antibody. The positive staining is shown as brown. Representative light micrographs are shown. F and G: pSmad2 protein levels in kidney cortex from UUO or sham group of mice were determined by Western blotting. Data are presented as means ± SE (n = 5–6 mice/group). *P < 0.05 vs. WT/sham group or saline group. #P < 0.05 vs. WT/UUO group. &P < 0.05 vs. Tg/sham group.
Fig. 4.
Fig. 4.
Increasing PKG activity reduced transforming growth factor (TGF)-β/Smad pathway in a UUO mouse model. A–D: kidney TGF-β1 mRNA and protein levels from UUO or sham group of mice were determined by real-time PCR and Western blotting, respectively. E: kidney sections from mice were stained with anti-TGF-β1 antibody. The positive staining is shown as brown. Representative light micrographs are shown. F and G: pSmad2 protein levels in kidney cortex from UUO or sham group of mice were determined by Western blotting. Data are presented as means ± SE (n = 5–6 mice/group). *P < 0.05 vs. WT/sham group or saline group. #P < 0.05 vs. WT/UUO group. &P < 0.05 vs. Tg/sham group.
Fig. 5.
Fig. 5.
Increasing PKG activity reduced renal macrophage infiltration in a UUO mouse model. A and B: F4/80 mRNA levels in kidney cortex from UUO or sham groups of mice were determined by real-time PCR. Data are presented as means ± SE (n = 5–6 mice/group). *P < 0.05 vs. WT/sham group or saline group. #P < 0.05 vs. WT/UUO group. &P < 0.05 vs. Tg/sham group. C and D: kidney sections from mice were stained with anti-F4/80 antibody. The positive staining is shown as brown. Representative light micrographs are shown. Scale bars = 100 μm.
Fig. 6.
Fig. 6.
Increasing PKG activity reduced kidney inflammation in a UUO mouse model. TNF-α (A, B) and ICAM-1 (C, D) mRNA levels in the kidney cortex from different groups of mice were determined by real-time PCR. Data are presented as means ± SE (n = 5–6 mice/group). *P < 0.05 vs. WT/sham group or saline group. #P < 0.05 vs. WT/UUO group. &P < 0.05 vs. Tg/sham group.
Fig. 7.
Fig. 7.
Increasing PKG activity reduced TGF-β1 production in the conditioned media (CM) from angiotensin II (ANG II)-treated macrophages or proximal tubular cells (PTC). A: macrophages were isolated from WT or PKG (Tg) mice. The expressions of PKG transgene and PKG activity (p-VASP) were determined by Western blotting. B–C: TGF-β1 protein levels in the CM from human ANG II (1 μM)-treated macrophages (MΦ) or PTC isolated from WT or PKG-I Tg mice were measured by ELISA. Data are presented as means ± SE (n = 3 individual experiments). ^P < 0.05 vs. WT MΦ. #P < 0.05 vs. WT/ANG II.
Fig. 8.
Fig. 8.
Increasing PKG activity reduced TGF-β1 or ANG II-induced α-SMA and collagen I production in PTC. PTC were isolated from WT or PKG (Tg) mice and treated by TGF-β1 (A–B; at 5 ng/ml) or human ANG II (C–D; 1 μM) for 24 h. α-SMA and collagen I protein levels were determined by Western blotting. Data are presented as means ± SE (n = 3 individual experiments). *P < 0.05 vs. WT/control. #P < 0.05 vs. WT/TGF-β1. ^P < 0.05 vs. WT/ANG II.

References

    1. Buvat J, Buttner H, Hatzimouratidis K, Vendeira PA, Moncada I, Boehmer M, Henneges C, Boess FG. Adherence to initial PDE-5 inhibitor treatment: randomized open-label study comparing tadalafil once a day, tadalafil on demand, and sildenafil on demand in patients with erectile dysfunction. J Sex Med 10: 1592–1602, 2013 - PubMed
    1. Chevalier RL, Forbes MS, Thornhill BA. Ureteral obstruction as a model of renal interstitial fibrosis and obstructive nephropathy. Kidney Int 75: 1145–1152, 2009 - PubMed
    1. Cui W, Maimaitiyiming H, Qi X, Norman H, Wang S. Thrombospondin 1 mediates renal dysfunction in a mouse model of high fat diet-induced obesity. Am J Physiol Renal Physiol 305: F871–F880, 2013 - PMC - PubMed
    1. Diamond JR, Ricardo SD, Klahr S. Mechanisms of interstitial fibrosis in obstructive nephropathy. Semin Nephrol 18: 594–602, 1998 - PubMed
    1. Ding G, Pesek-Diamond I, Diamond JR. Cholesterol, macrophages, and gene expression of TGF-β1 and fibronectin during nephrosis. Am J Physiol Renal Fluid Electrolyte Physiol 264: F577–F584, 1993 - PubMed

Publication types

MeSH terms