

Defective chemokine signal integration in leukocytes lacking activator of G protein signaling 3 (AGS3)
- PMID: 24573680
- PMCID: PMC4036190
- DOI: 10.1074/jbc.M113.515031
Defective chemokine signal integration in leukocytes lacking activator of G protein signaling 3 (AGS3)
Abstract
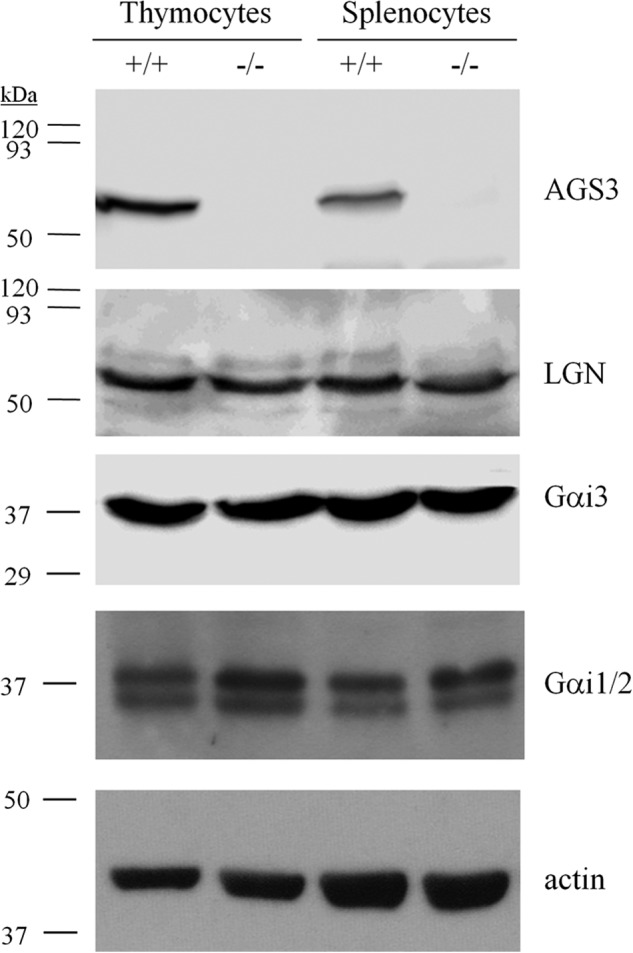
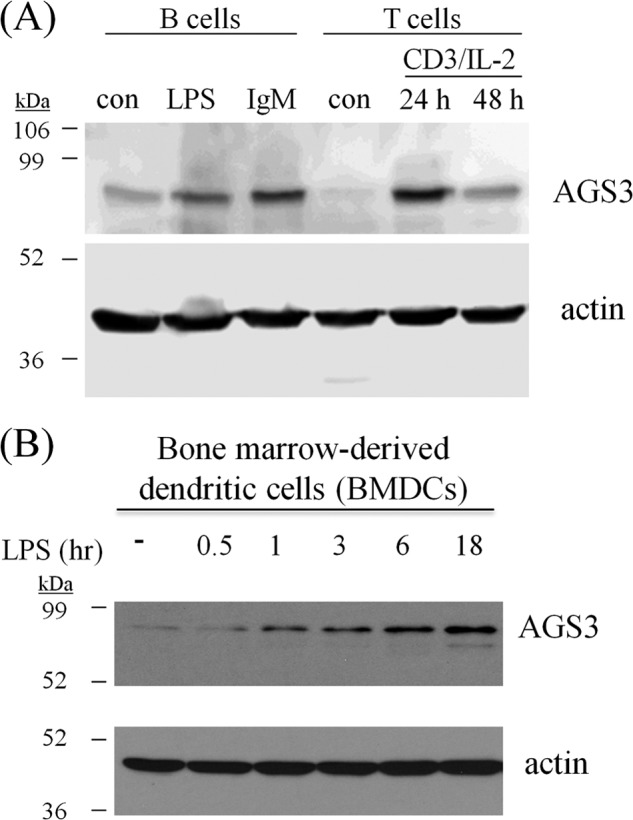
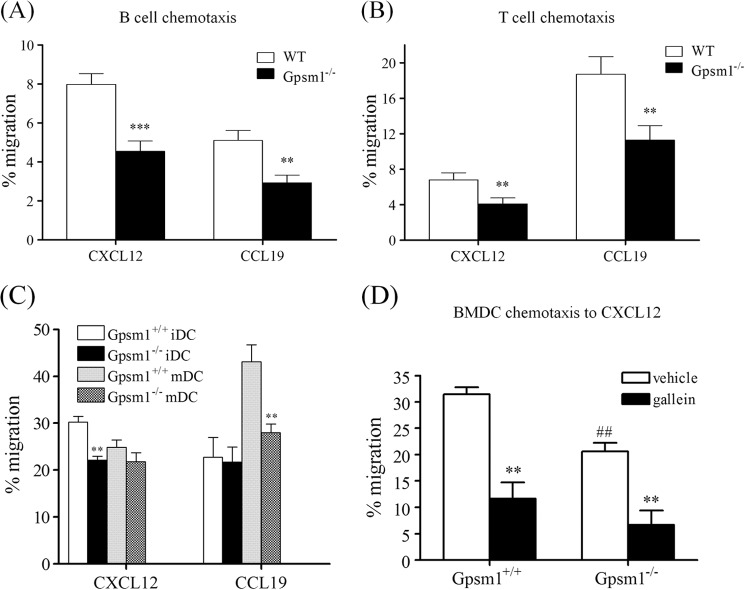
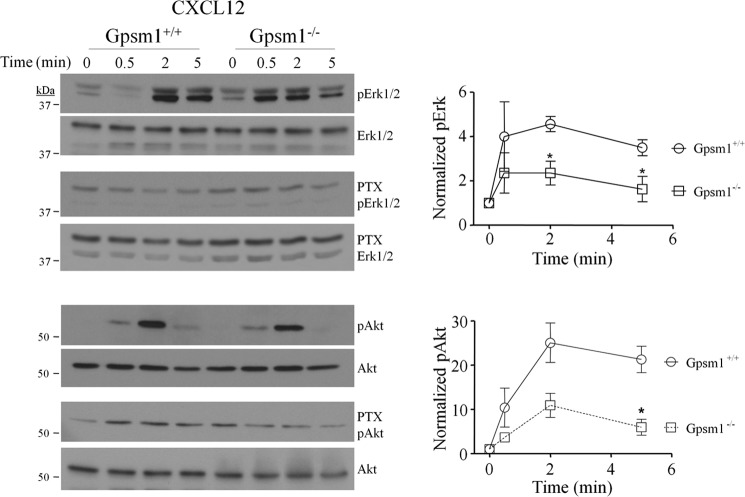
Activator of G-protein signaling 3 (AGS3, gene name G-protein signaling modulator-1, Gpsm1), an accessory protein for G-protein signaling, has functional roles in the kidney and CNS. Here we show that AGS3 is expressed in spleen, thymus, and bone marrow-derived dendritic cells, and is up-regulated upon leukocyte activation. We explored the role of AGS3 in immune cell function by characterizing chemokine receptor signaling in leukocytes from mice lacking AGS3. No obvious differences in lymphocyte subsets were observed. Interestingly, however, AGS3-null B and T lymphocytes and bone marrow-derived dendritic cells exhibited significant chemotactic defects as well as reductions in chemokine-stimulated calcium mobilization and altered ERK and Akt activation. These studies indicate a role for AGS3 in the regulation of G-protein signaling in the immune system, providing unexpected venues for the potential development of therapeutic agents that modulate immune function by targeting these regulatory mechanisms.
Keywords: AGS3; Chemokines; Chemotaxis; Cxcr4; G Proteins; G-protein-coupled Receptors (GPCR); GPR Motif; Gpsm1; Gαi; Gβγ.
Figures


Similar articles
-
Regulation of Chemokine Signal Integration by Activator of G-Protein Signaling 4 (AGS4).J Pharmacol Exp Ther. 2017 Mar;360(3):424-433. doi: 10.1124/jpet.116.238436. Epub 2017 Jan 6. J Pharmacol Exp Ther. 2017. PMID: 28062526 Free PMC article.
-
Regulation of the AGS3·G{alpha}i signaling complex by a seven-transmembrane span receptor.J Biol Chem. 2010 Oct 29;285(44):33949-58. doi: 10.1074/jbc.M110.138073. Epub 2010 Aug 17. J Biol Chem. 2010. PMID: 20716524 Free PMC article.
-
Role of G-proteins and phosphorylation in the distribution of AGS3 to cell puncta.J Cell Sci. 2018 Dec 5;131(23):jcs216507. doi: 10.1242/jcs.216507. J Cell Sci. 2018. PMID: 30404823 Free PMC article.
-
Activators of G-protein signaling 3: a drug addiction molecular gateway.Behav Pharmacol. 2010 Sep;21(5-6):500-13. doi: 10.1097/FBP.0b013e32833dcfa5. Behav Pharmacol. 2010. PMID: 20700046 Free PMC article. Review.
-
Chemokines, G proteins and natural killer cells.Arch Immunol Ther Exp (Warsz). 2000;48(2):65-72. Arch Immunol Ther Exp (Warsz). 2000. PMID: 10807045 Review.
Cited by
-
GPSM1 impairs metabolic homeostasis by controlling a pro-inflammatory pathway in macrophages.Nat Commun. 2022 Nov 25;13(1):7260. doi: 10.1038/s41467-022-34998-9. Nat Commun. 2022. PMID: 36434066 Free PMC article.
-
Comprehensive Analysis of the miRNA-mRNA Pathological Regulatory Network of Intestinal CD4 + T Cells in Parkinson's Disease.J Mol Neurosci. 2023 Aug;73(7-8):529-538. doi: 10.1007/s12031-023-02132-z. Epub 2023 Jun 24. J Mol Neurosci. 2023. PMID: 37354355
-
RNA Sequencing Reveals Diverse Functions of Amniotic Fluid Neutrophils and Monocytes/Macrophages in Intra-Amniotic Infection.J Innate Immun. 2021;13(2):63-82. doi: 10.1159/000509718. Epub 2020 Nov 5. J Innate Immun. 2021. PMID: 33152737 Free PMC article.
-
AGS3 and Gαi3 Are Concomitantly Upregulated as Part of the Spindle Orientation Complex during Differentiation of Human Neural Progenitor Cells.Molecules. 2020 Nov 6;25(21):5169. doi: 10.3390/molecules25215169. Molecules. 2020. PMID: 33172018 Free PMC article.
-
Intersection of two key signal integrators in the cell: activator of G-protein signaling 3 and dishevelled-2.J Cell Sci. 2020 Sep 4;133(17):jcs247908. doi: 10.1242/jcs.247908. J Cell Sci. 2020. PMID: 32737219 Free PMC article.
References
-
- Cho H., Kehrl J. H. (2009) Regulation of immune function by G protein-coupled receptors, trimeric G proteins, and RGS proteins. Prog. Mol. Biol. Transl. Sci. 86, 249–298 - PubMed
-
- Sato M., Blumer J. B., Simon V., Lanier S. M. (2006) Accessory proteins for G proteins: Partners in signaling. Annu. Rev. Pharmacol. Toxicol. 46, 151–187 - PubMed
-
- Han S. B., Moratz C., Huang N. N., Kelsall B., Cho H., Shi C. S., Schwartz O., Kehrl J. H. (2005) Rgs1 and Gnai2 regulate the entrance of B lymphocytes into lymph nodes and B cell motility within lymph node follicles. Immunity 22, 343–354 - PubMed
-
- Hwang I. Y., Park C., Kehrl J. H. (2007) Impaired trafficking of Gnai2+/− and Gnai2−/− T lymphocytes: implications for T cell movement within lymph nodes. J. Immunol. 179, 439–448 - PubMed
Publication types
MeSH terms
Substances
Grants and funding
- P20GM103499/GM/NIGMS NIH HHS/United States
- P20 GM103499/GM/NIGMS NIH HHS/United States
- R01 GM086510/GM/NIGMS NIH HHS/United States
- AR056670/AR/NIAMS NIH HHS/United States
- P30 CA138313/CA/NCI NIH HHS/United States
- L60 MD003100/MD/NIMHD NIH HHS/United States
- C06 RR015455/RR/NCRR NIH HHS/United States
- T32 CA119945/CA/NCI NIH HHS/United States
- T32CA119945/CA/NCI NIH HHS/United States
- DA025896/DA/NIDA NIH HHS/United States
- GM086510/GM/NIGMS NIH HHS/United States
- R01 DA025896/DA/NIDA NIH HHS/United States
- R01 AR056670/AR/NIAMS NIH HHS/United States
- S10 RR027777/RR/NCRR NIH HHS/United States
- ImNIH/Intramural NIH HHS/United States
LinkOut - more resources
Full Text Sources
Other Literature Sources
Molecular Biology Databases
Miscellaneous
