. 2014 Apr 11;289(15):10359-10377.
doi: 10.1074/jbc.M113.526665. Epub 2014 Feb 26.

The presence of multiple cellular defects associated with a novel G50E iron-sulfur cluster scaffold protein (ISCU) mutation leads to development of mitochondrial myopathy

Affiliations

The presence of multiple cellular defects associated with a novel G50E iron-sulfur cluster scaffold protein (ISCU) mutation leads to development of mitochondrial myopathy

Prasenjit Prasad Saha et al. J Biol Chem. .

Abstract

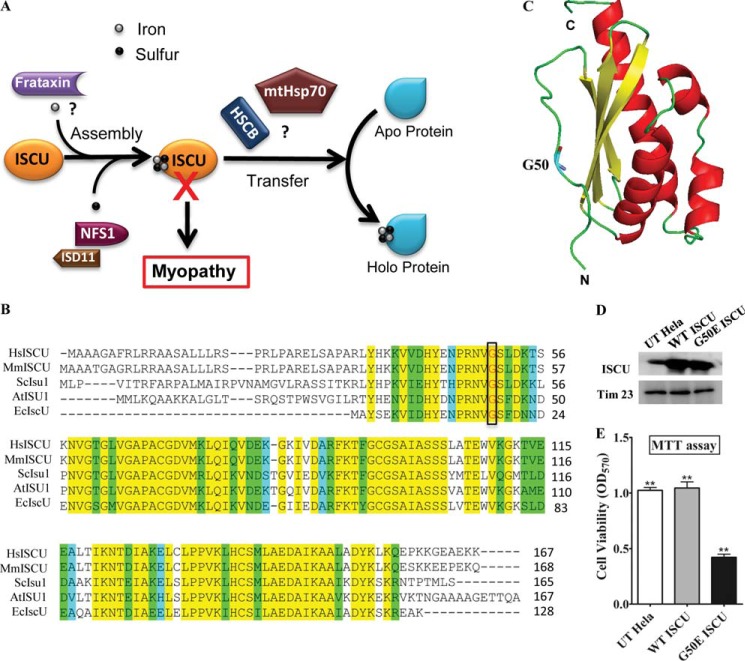
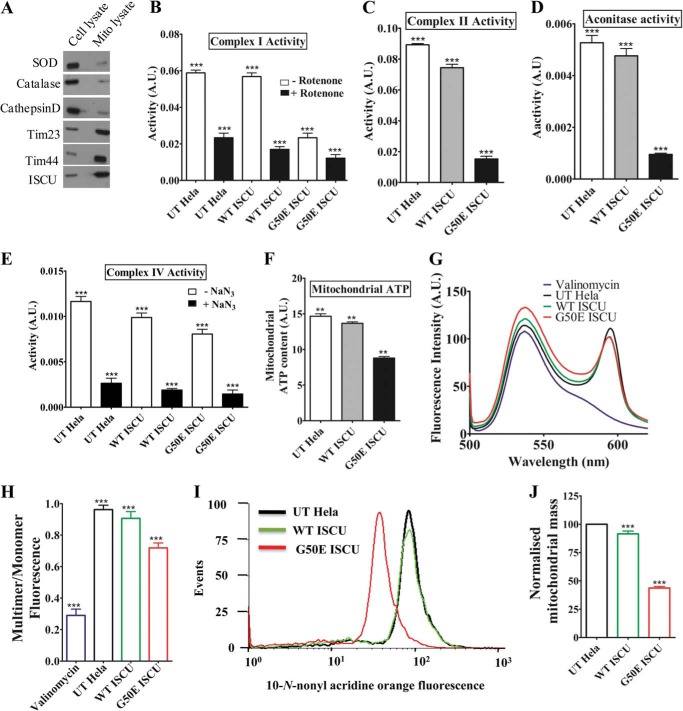
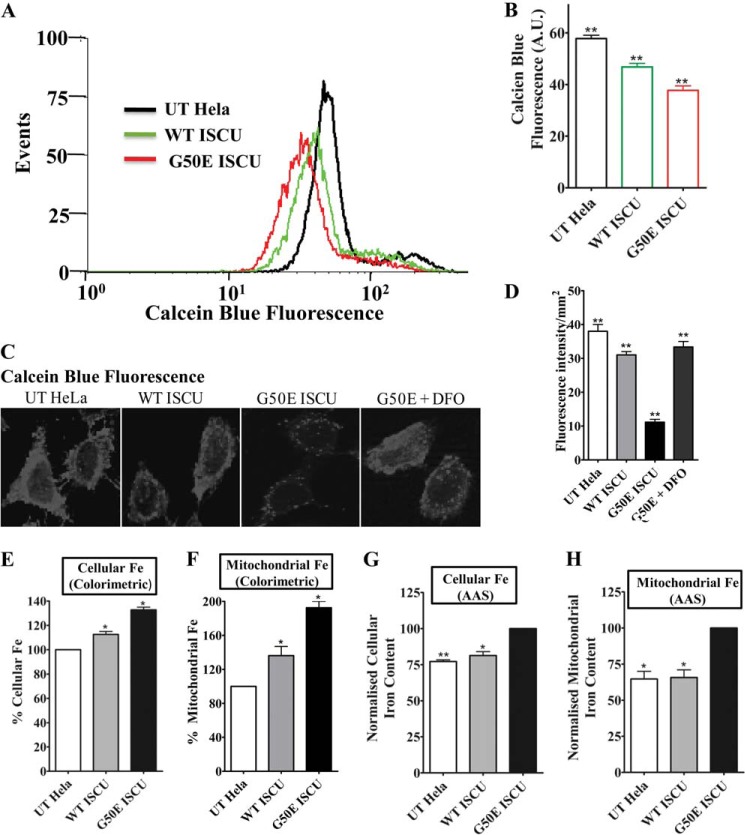
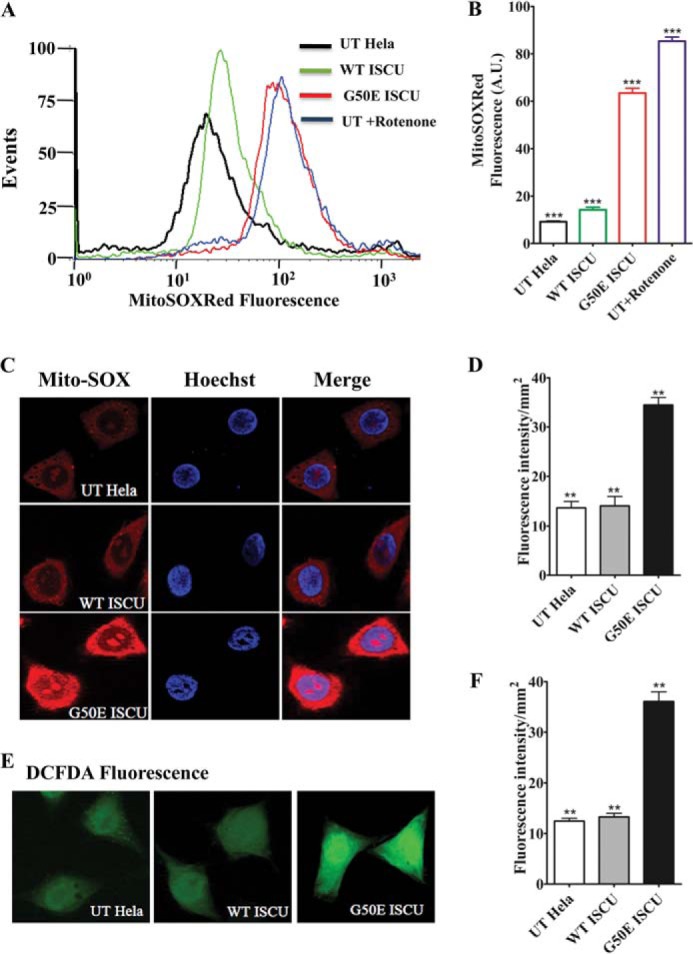
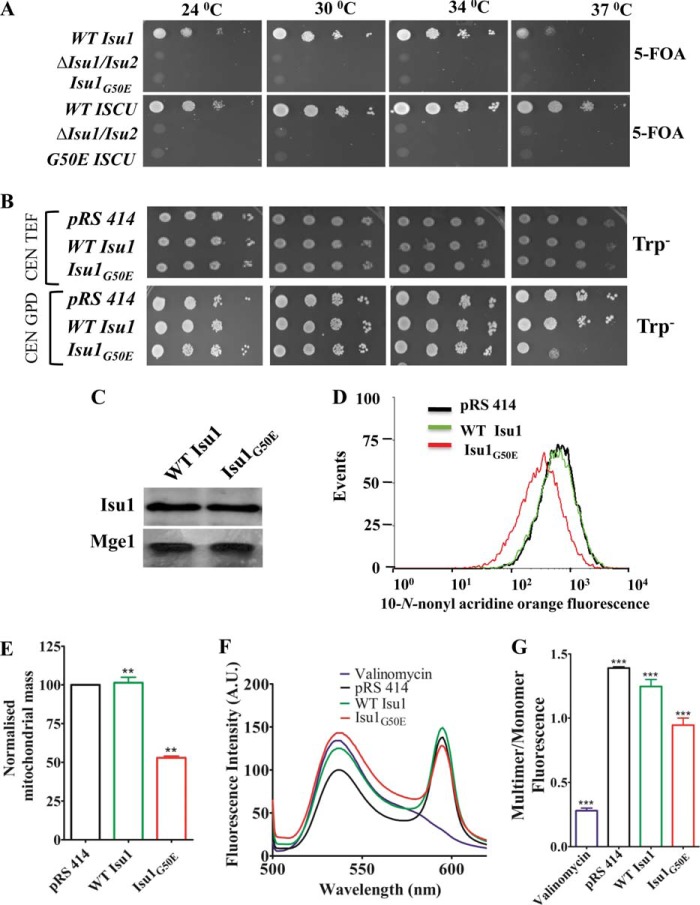
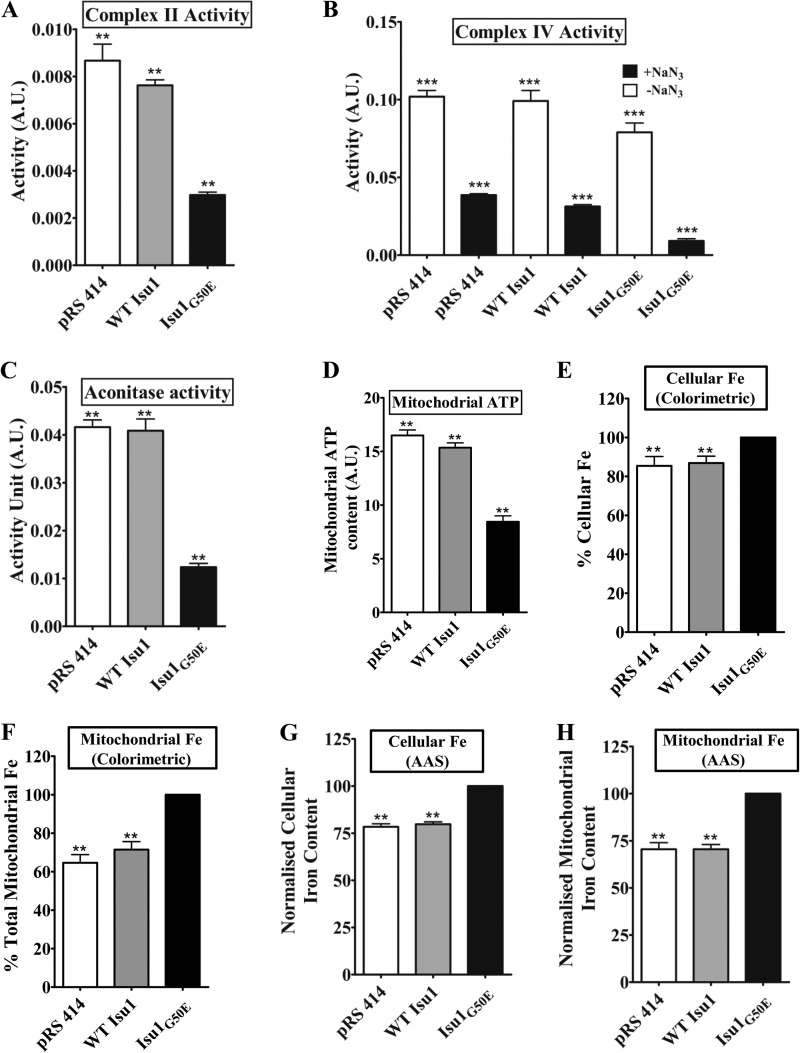
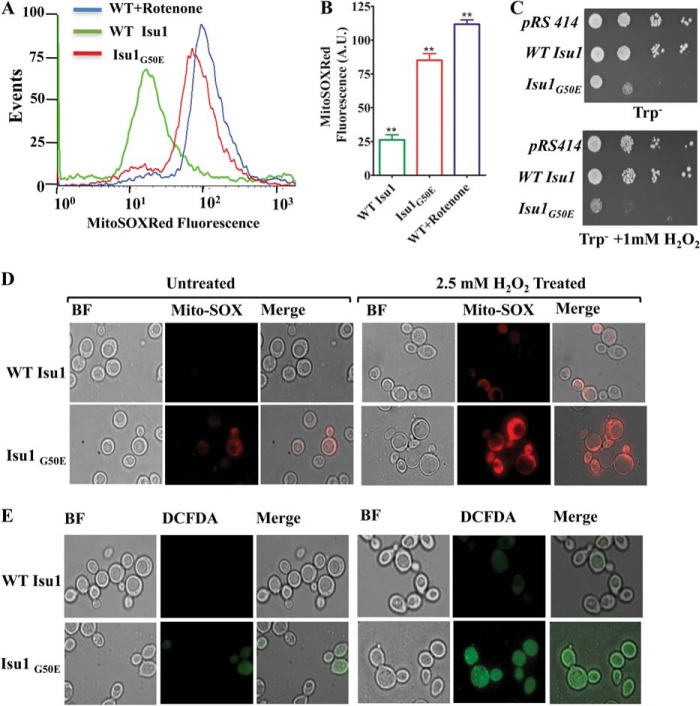
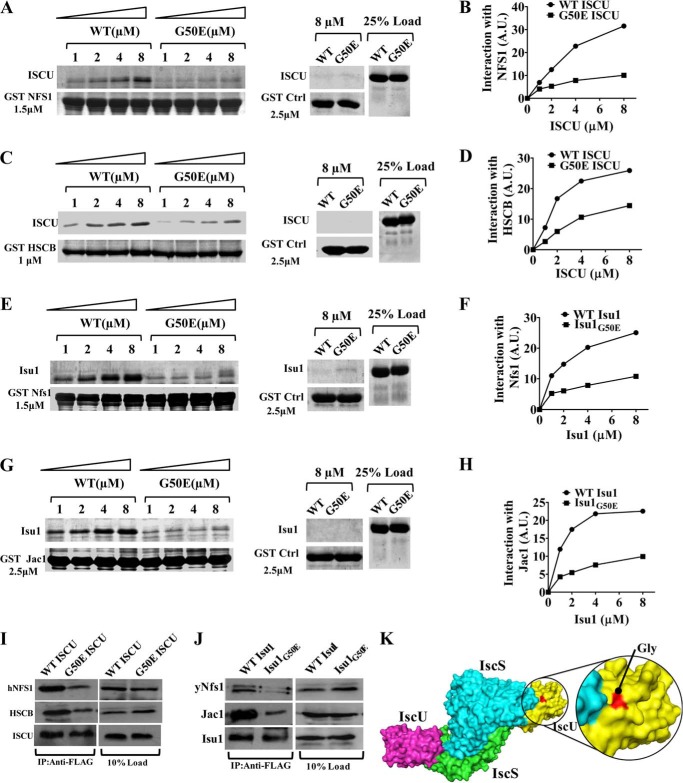
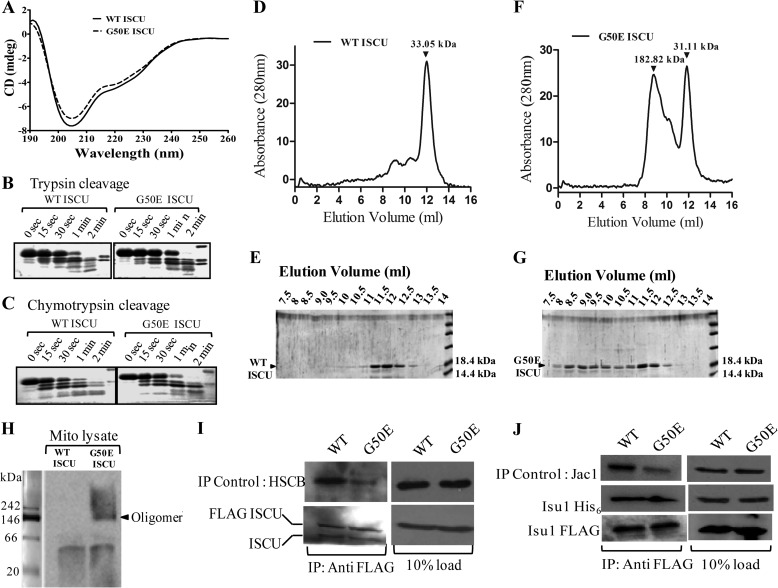
Iron-sulfur (Fe-S) clusters are versatile cofactors involved in regulating multiple physiological activities, including energy generation through cellular respiration. Initially, the Fe-S clusters are assembled on a conserved scaffold protein, iron-sulfur cluster scaffold protein (ISCU), in coordination with iron and sulfur donor proteins in human mitochondria. Loss of ISCU function leads to myopathy, characterized by muscle wasting and cardiac hypertrophy. In addition to the homozygous ISCU mutation (g.7044G→C), compound heterozygous patients with severe myopathy have been identified to carry the c.149G→A missense mutation converting the glycine 50 residue to glutamate. However, the physiological defects and molecular mechanism associated with G50E mutation have not been elucidated. In this report, we uncover mechanistic insights concerning how the G50E ISCU mutation in humans leads to the development of severe ISCU myopathy, using a human cell line and yeast as the model systems. The biochemical results highlight that the G50E mutation results in compromised interaction with the sulfur donor NFS1 and the J-protein HSCB, thus impairing the rate of Fe-S cluster synthesis. As a result, electron transport chain complexes show significant reduction in their redox properties, leading to loss of cellular respiration. Furthermore, the G50E mutant mitochondria display enhancement in iron level and reactive oxygen species, thereby causing oxidative stress leading to impairment in the mitochondrial functions. Thus, our findings provide compelling evidence that the respiration defect due to impaired biogenesis of Fe-S clusters in myopathy patients leads to manifestation of complex clinical symptoms.

Keywords: Electron Transport System (ETS); Hsp70; Iron-Sulfur Cluster; Iron-Sulfur Protein; J-protein; Mitochondrial Diseases; Molecular Chaperone; Myopathy; Reactive Oxygen Species (ROS).


Figures

FIGURE 1.
FIGURE 1.
Comparative analysis of ISCU proteins and measurement of cellular viability. A, a proposed model of Fe-S cluster synthesis highlighting ISCU as a central scaffold in the biogenesis process. Assembly of the Fe-S cluster includes transfer of the sulfur atoms from the NFS1-ISD11 complex and iron from the putative iron donor protein frataxin. The transfer and incorporation into recipient apoproteins are facilitated by the ATP-dependent mtHsp70 chaperone GRP75 and the DnaJ-like cochaperone HSCB. B, predicted orthologs of ISCU from different species (Homo sapiens (Hs), Mus musculus (Mm), S. cerevisiae (Sc), Arabidopsis thaliana (At), and E. coli (Ec)) are aligned using ClustalW software. Identical, conserved, and semiconserved residues are highlighted in yellow, green, and cyan, respectively. The amino acid positions corresponding to the myopathy mutation (glycine 50) are boxed. C, the structure of human ISCU (aa 44–162) is modeled based on M. musculus Iscu (Protein Data Bank code 1wfz) using the SWISS-MODEL program. The N-terminal side chain depicting the conserved residue glycine 50 is highlighted. N and C, N and C terminus of ISCU, respectively. D, ISCU protein levels in the mitochondrial lysate of the UT HeLa cells and cells carrying WT ISCU and G50E ISCU in a pCI-neo plasmid after 72 h of transfection. The mitochondrial protein Tim23 was used as a loading control. E, MTT assay for the measurement of cellular viability (represented as bars) of UT, WT, and G50E mutant in HeLa cells. p < 0.05 was defined as significant, and asterisks are used to denote significance as follows: *, p < 0.05; **, p < 0.01; ***, p < 0.001. Error bars, S.E.
FIGURE 2.
FIGURE 2.
Measurement of Fe-S cluster enzyme activity, cellular respiration, mitochondrial mass, and membrane potential in HeLa cells. A, the purity and enrichment of mitochondria obtained from HeLa cells were analyzed by immunodecoration using antibodies against mitochondrial specific markers as positive controls (Tim23, Tim44, and ISCU) and other organellar specific antibodies, such as catalase (peroxisomes), cathepsin (lysosomal), and SOD (cytosolic/nuclear) as negative controls. Equivalent amounts of cell and mitochondrial lysates (100 μg of protein) were loaded for the comparison. B, activity of mitochondrial complex I of the ETC in UT HeLa cells overexpressing WT ISCU and G50E ISCU in the presence or absence of the complex I inhibitor rotenone. A.U., arbitrary units. C, activity of ETC complex II in the presence of inhibitors of complex I, III, and IV represented in bar charts. D, assessment of the activity of mitochondrial matrix enzyme aconitase in HeLa cells denoted in bar charts. E, activity of complex IV of the ETC measured in the presence or absence of complex IV inhibitor sodium azide (NaN3). F, relative ATP levels measured in mitochondria isolated from UT, WT, and mutant protein-expressing HeLa cells using the mitochondrial ToxGlo assay kit. G and H, purified mitochondria isolated from HeLa cells were stained with the JC-1 dye and subjected to an excitation at 490 nm followed by an emission wavelength scan ranging from 500 to 620 nm. The fluorescence intensity values obtained were plotted against the wavelengths to calculate the relative distribution of polarized versus depolarized mitochondria (G). A relative fluorescence intensity obtained from the JC-1 dye (G) was quantified and plotted as a ratio of multimer (590 nm) to monomer (530 nm) (H). I and J, the mean fluorescence intensity histogram for UT, WT, and G50E ISCU HeLa cells stained with NAO followed by flow cytometric analysis for the measurement of overall mitochondrial mass. The values were plotted based on three independent experiments (I). The total mitochondrial mass for each HeLa cell line obtained from I was quantitated, and normalized values were plotted on a bar chart (J). p < 0.05 was defined as significant, and asterisks are used to denote significance as follows: *, p < 0.05; **, p < 0.01; ***, p < 0.001. Error bars, S.E.
FIGURE 3.
FIGURE 3.
Estimation of total cellular and mitochondrial iron content of G50E ISCU in HeLa cells. A, flow cytometric estimation of overall cellular free iron levels using calcein blue dye in UT HeLa cells and cells harboring the WT ISCU and G50E ISCU. A total of 10,000 events were analyzed for each case, and the fluorescence intensity values were plotted as a mean of three independent experiments. B, the free iron content was quantitated from the FACS experiment in A and represented in a bar chart. A.U., arbitrary units. C, calcein blue fluorescence images of UT, WT ISCU, G50E ISCU, and G50E ISCU HeLa cells treated with 1 mm iron chelator, deferoxamine (DFO). D, the calcein blue fluorescence intensity obtained from the images in C was quantitated using ImageJ software and represented in a bar chart. The total cellular iron (E) and mitochondrial iron levels (F) in HeLa cells were determined by colorimetric analysis and represented in a bar chart after normalization of values obtained for G50E and WT ISCU against UT. The total cellular iron (G) and mitochondrial iron levels (H) in each HeLa cell type were determined using AAS. The data are represented in a bar chart after normalization of values obtained for UT and WT against G50E ISCU. p < 0.05 was defined as significant, and asterisks are used to denote significance as follows: *, p < 0.05; **, p < 0.01; ***, p < 0.001. Error bars, S.E.
FIGURE 4.
FIGURE 4.
Estimation of mitochondrial and total cellular ROS of G50E ISCU in HeLa cells. A, the mitochondrial superoxide level in UT HeLa cells and cells harboring the WT ISCU and G50E ISCU were estimated flow cytometrically using fluorescent MitoSOX Red dye. B, the total superoxide levels obtained from the aforementioned experiment (A) were quantitated and represented in a bar chart. The UT cells treated with 1 mm rotenone were used as a positive control. For flow cytometry experiments, 10,000 events were analyzed for each case, and the values were plotted based on three independent experiments. C, untransfected HeLa cells and cells transfected with WT ISCU and G50E ISCU were stained with the mitochondrial superoxide indicator MitoSOX Red (red fluorescence) and nuclear counterstain Hoechst 33342 (blue fluorescence), and the images were recorded in a Zeiss Apotome fluorescence microscope using a ×63 objective lens. D, the total MitoSOX Red fluorescence intensity of images from the aforementioned experiments was quantitated using ImageJ software. E, fluorescence images of UT HeLa cells and cells harboring WT ISCU and G50E ISCU stained with H2DCF-DA dye to detect enhancement in overall cellular ROS levels (green fluorescence). The images were recorded in a Leica fluorescence microscope using a ×63 objective lens. F, the total H2DCF-DA dye fluorescence intensity from the images (E) was quantitated using ImageJ software. p < 0.05 was defined as significant, and asterisks are used to denote significance as follows: *, p < 0.05; **, p < 0.01; ***, p < 0.001. Error bars, S.E.
FIGURE 5.
FIGURE 5.
Growth and functional defects associated with analogous G50E mutation in yeast Isu1. A, Δisu1/isu2 yeast strain carrying a WT copy of ISU1 in pRS316 plasmid transformed with WT ISU1 or isu1G50E mutant and subjected to serial drop dilution analysis on 5-fluoroorotic acid medium (5-FOA) and incubated at the indicated temperatures for 96 h (top). Similarly, human WT ISCU and G50E ISCU mutant in pRS414 TEF vector were transformed in the Δisu1/isu2 yeast strain and subjected to serial drop dilution analysis on 5-fluoroorotic acid medium as described in the aforementioned analysis (bottom). B, Δisu1/isu2 yeast strain harboring a WT copy of ISU1 in pRS316 plasmid was transformed with WT ISU1 and mutant isu1G50E in a centromeric plasmid pRS414 TEF (top) or pRS414 GPD (bottom). Cells were spotted on Trp plates followed by incubation for 72 h at the indicated temperatures. C, immunoblot analysis for Isu1 protein levels in the mitochondrial lysates of overexpressed strains (under pRS414 GPD vector as indicated in B) prepared from WT and mutant yeast cells using anti-FLAG antibodies. The mitochondrial protein Mge1 was used as a loading control. D and E, the estimation of mitochondrial mass was performed by flow cytometric analysis using NAO dye. For each flow cytometric analysis, 10,000 events were analyzed, and the relative fluorescence intensity values obtained from three independent experiments were plotted (D). Relative mitochondrial mass in each yeast strain determined from the aforementioned FACS analysis was quantitated (E). F, purified mitochondria from yeast strains were stained with JC-1 dye to determine the mitochondrial membrane potential by scanning the emission wavelength ranging from 500 to 620 nm, and the fluorescence intensity (absorbance units (A.U.)) was plotted against the wavelength. Mitochondria treated with the valinomycin were used as a positive control. G, the ratio of fluorescence intensities between multimer (590 nm) and monomer (530 nm) was quantitated and represented in a bar chart. p < 0.05 was defined as significant, and asterisks are used to denote significance as follows: *, p < 0.05; **, p < 0.01; ***, p < 0.001. Error bars, S.E.
FIGURE 6.
FIGURE 6.
Measurement of enzymatic activity, respiration, and iron levels in isu1G50E mutant yeast strains. A, activity of mitochondrial complex II of the ETC in yeast strains carrying either vector alone control (pRS414), or WT ISU1, or isu1G50E in pRS414 GPD plasmid in the presence or absence of inhibitors of complex I, III, and IV. B, bar chart indicating the activity of complex IV of the ETC in yeast cells in the presence or absence of complex IV inhibitor sodium azide (NaN3). C, activity of mitochondrial matrix enzyme aconitase in aforementioned yeast strains. D, quantification of ATP levels in the mitochondria isolated from WT, and mutant yeast strains were measured using the mitochondrial ToxGlo assay. E and F, estimation of total cellular iron content (E) and mitochondrial iron levels (F) in WT and mutant strains were determined by colorimetric analysis. The normalized values against the mutant strain are plotted on a bar chart. G and H, measurement of total cellular iron content (G) and mitochondrial iron levels (H) in the aforementioned yeast strains obtained using AAS analysis. The normalized values against the mutant strain are plotted on a bar chart. p < 0.05 was defined as significant, and asterisks are used to denote significance as follows: *, p < 0.05; **, p < 0.01; ***, p < 0.001. A.U., absorbance units. Error bars, S.E.
FIGURE 7.
FIGURE 7.
Estimation of cellular ROS levels and oxidative stress sensitivity of isu1G50E. A, flow cytometric analysis of mitochondrial superoxide levels in yeast strains carrying WT ISU1 and isu1G50E in pRS414 GPD plasmid using MitoSOX Red dye. Relative superoxide level obtained from the aforementioned analysis was quantitated and represented in a bar chart (B). WT cells treated with 1 mm rotenone were set as a positive control. For flow cytometry experiments, 10,000 events were analyzed for each case, and the values were plotted based on three independent experiments. C, assessment of oxidative stress sensitivity of WT and mutant strains performed by drop test analysis on selective medium with and without treatment of 1 mm H2O2 for 2 h. Equivalent numbers of yeast cells from the WT Isu1 and isu1G50E strains were spotted by serial dilution and allowed to grow at 37 °C for 72 h. D, fluorescence imaging analysis of WT Isu1 and isu1G50E yeast strains stained with mitochondrial superoxide indicator MitoSOX Red (red fluorescence). The images obtained for untreated strains are represented in the left-hand panels (bright field (BF), MitoSOX (middle), and Merge column). The images acquired for the strains after treatment with 1 mm H2O2 for 2 h are indicated in the right-hand panels. E, fluorescence images of WT Isu1 and isu1G50E yeast strains stained with cellular peroxide indicator H2DCF-DA (green fluorescence). The images obtained for untreated strains are represented in the left-hand panels, and images after treatment with 1 mm H2O2 for 2 h are indicated in the right-hand panels. The images were recorded in a Leica fluorescence microscope using a ×100 objective lens. p < 0.05 was defined as significant, and asterisks are used to denote significance as follows: *, p < 0.05; **, p < 0.01; ***, p < 0.001. Error bars, S.E.
FIGURE 8.
FIGURE 8.
Interaction of G50E mutant (ISCU/Isu1) with hNFS1/yNfs1 and HSCB/Jac1 by GST pull-down analysis. Prebound 1.5 μm GST-hNFS1 (A) and 1.0 μm GST-HSCB (C) were incubated with increasing concentrations of purified WT and mutant human ISCU protein, as indicated. The unbound proteins were washed with buffer and analyzed by SDS-PAGE followed by Coomassie dye staining. GST alone (2.5 μm) was used as a negative control, and 25% input of ISCU served as a loading control. The band intensities were densitometrically quantitated using ImageJ software for hNFS1 (B) and HSCB (D). E–H, prebound 1.5 μm GST-yNfs1 (E) and 2.5 μm of GST-Jac1 (G) were incubated with increasing concentrations of purified WT and mutant yeast Isu1 protein as indicated. The unbound proteins were washed with buffer and analyzed by SDS-PAGE followed by Coomassie dye staining. The band intensities were densitometrically quantitated using ImageJ software for yNfs1 (F) and Jac1 (H). I, mitochondria lysates were prepared from HeLa cells expressing either FLAG-tagged WT or G50E ISCU in buffer A containing 0.2% Tween 20 and subjected to immunoprecipitation using anti-FLAG antibodies. Fractions were analyzed for the presence of hNFS1 and HSCB by immunostaining. 10% of total mitochondrial extract was used as input co-IP control (right). J, FLAG-tagged WT Isu1 or isu1G50E mutant mitochondrial lysates were subjected to immunoprecipitation using anti-FLAG antibodies and analyzed for the presence of yNfs1 and Jac1 by immunostaining. 10% of total mitochondrial extract was used as input co-IP control (right). K, surface representation of the (IscS-IscU)2 complex showing the two IscS molecules (green and cyan) and the two IscU molecules (purple and yellow). Close-up view, IscU surface highlights the glycine position in red, located adjacent to the interface of IscS and IscU.
FIGURE 9.
FIGURE 9.
Secondary structure analysis and oligomerization study of G50E ISCU. A, UV CD spectra of WT ISCU (solid line) and G50E ISCU (dashed line) in 20 mm phosphate buffer (pH 8) were recorded at 10 °C. B and C, 5 μg of WT ISCU (left) or G50E ISCU (right) protein was preincubated in cleavage buffer for 20 min at 10 °C. The proteolysis was initiated by the addition of 1 μl (1:50 dilution of 1 μg/μl stock) of trypsin (B) and/or chymotrypsin (C) as indicated. The reaction was stopped at the indicated time intervals using 2 mm PMSF. The samples were boiled in SDS sample buffer and analyzed using SDS-PAGE followed by Coomassie dye staining. D, gel filtration chromatography elution profile of WT ISCU protein separated on a Superdex 200 column with a single peak corresponding to the molecular size of ∼30–33 kDa indicated. E, elution fractions from the gel filtration of WT ISCU were analyzed on 15% SDS-PAGE and stained with Coomassie dye. F and G, gel filtration elution profile of G50E ISCU mutant separated under similar conditions. Two major peaks corresponding to molecular sizes ∼30–33 kDa and ∼180–185 kDa are highlighted (F). The eluted fractions from the gel filtration of G50E ISCU mutant were separated on 15% SDS-PAGE and stained with Coomassie Blue dye (G). H, mitochondrial lysate (500 μg of the protein) prepared from HeLa cells expressing either WT or G50E ISCU mutant was separated on BN-PAGE followed by immunostaining with anti-ISCU-specific antibody. The positions of dimer and oligomers are highlighted with reference to BN-PAGE markers. I, mitochondria lysates were prepared from HeLa cells expressing either FLAG-tagged WT or G50E ISCU in buffer A containing 0.2% Tween 20 and subjected to immunoprecipitation using anti-FLAG antibodies. The presence of endogenous WT ISCU and HSCB was detected by immunostaining using either anti-ISCU- or anti-HSCB-specific antibodies (left). 10% of total mitochondrial extract was used as input loading control for co-IP (right). J, co-IP was performed using mitochondrial lysate prepared from yeast cells expressing either FLAG-tagged WT Isu1 or isu1G50E and subjected to immunodetection. The blot was detected for the presence of His6-tagged WT Isu1 and Jac1 using anti-His, Jac1-specific antibodies (left). 10% of total mitochondrial extract was used as input co-IP control (right).

Similar articles

Cited by

References

    1. Craig E. A., Marszalek J. (2002) A specialized mitochondrial molecular chaperone system: a role in formation of Fe/S centers. Cell. Mol. Life Sci. 59, 1658–1665 - PMC - PubMed
    1. Craig E. A., Voisine C., Schilke B. (1999) Mitochondrial iron metabolism in the yeast Saccharomyces cerevisiae. Biol. Chem. 380, 1167–1173 - PubMed
    1. Lill R. (2009) Function and biogenesis of iron-sulphur proteins. Nature 460, 831–838 - PubMed
    1. Meyer J. (2008) Iron-sulfur protein folds, iron-sulfur chemistry, and evolution. J. Biol. Inorg. Chem. 13, 157–170 - PubMed
    1. Hinchliffe P., Sazanov L. A. (2005) Organization of iron-sulfur clusters in respiratory complex I. Science 309, 771–774 - PubMed

Publication types

MeSH terms