Review
. 2014 Sep;71(18):3583-97.
doi: 10.1007/s00018-014-1588-1. Epub 2014 Feb 28.

In vivo genome-wide binding of Id2 to E2F4 target genes as part of a reversible program in mice liver

Affiliations
Review

In vivo genome-wide binding of Id2 to E2F4 target genes as part of a reversible program in mice liver

Ivan Ferrer-Vicens et al. Cell Mol Life Sci. 2014 Sep.

Abstract

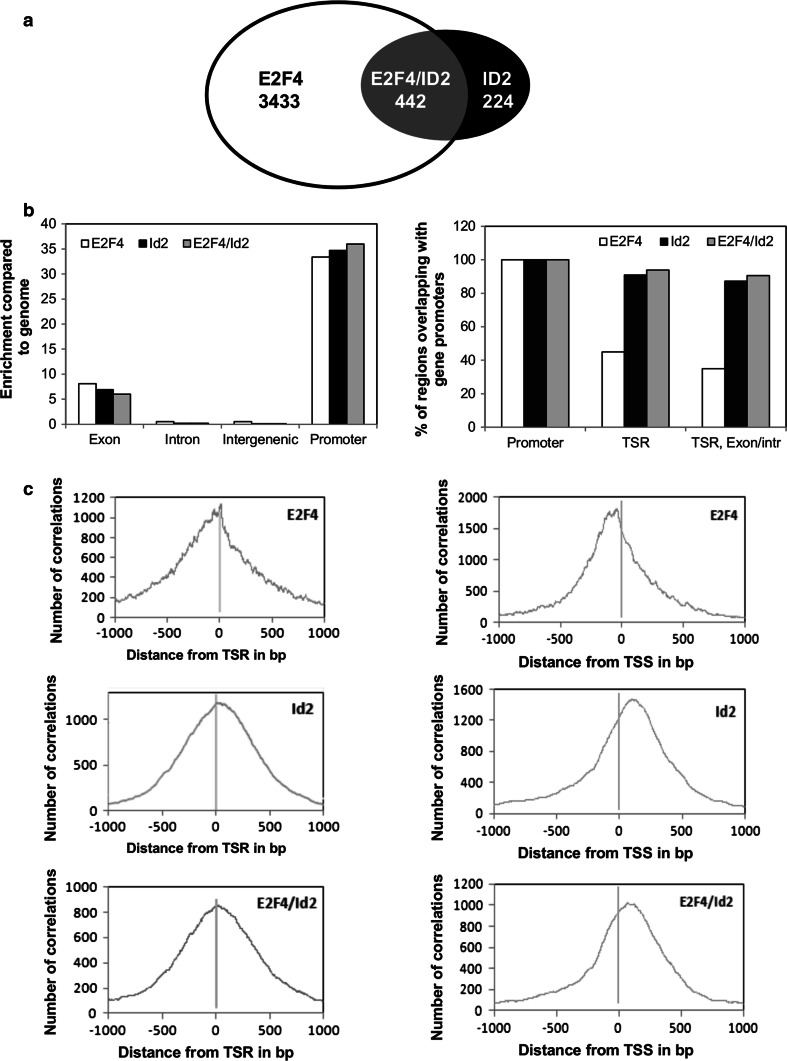
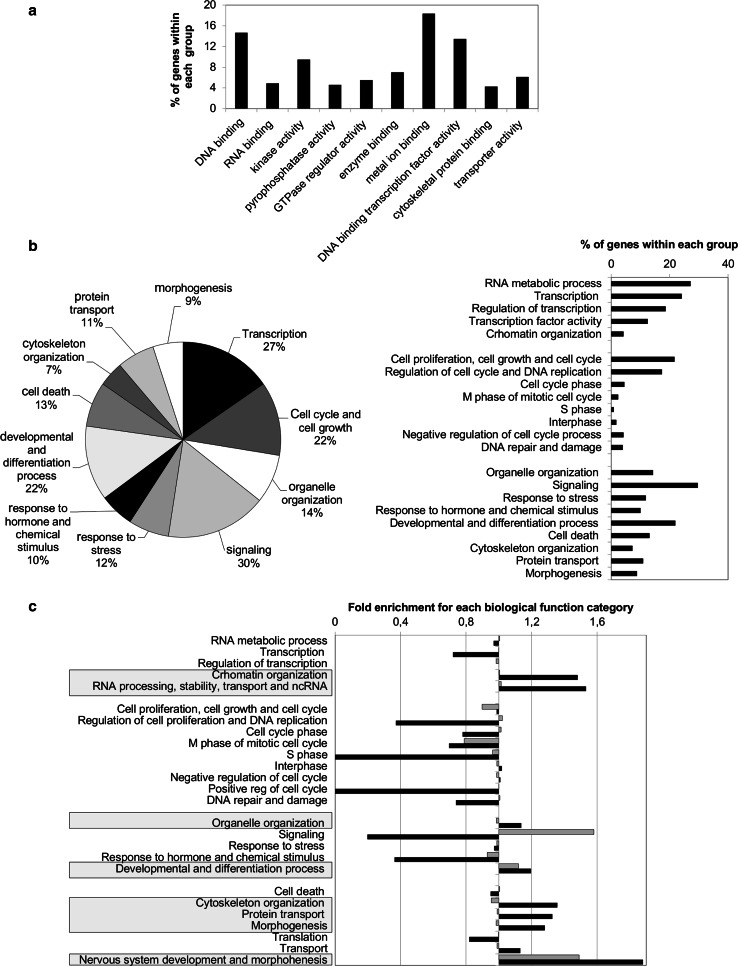
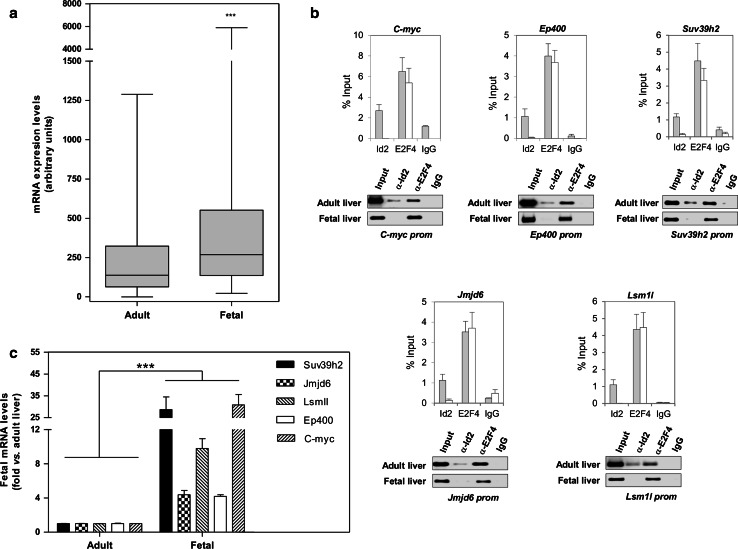
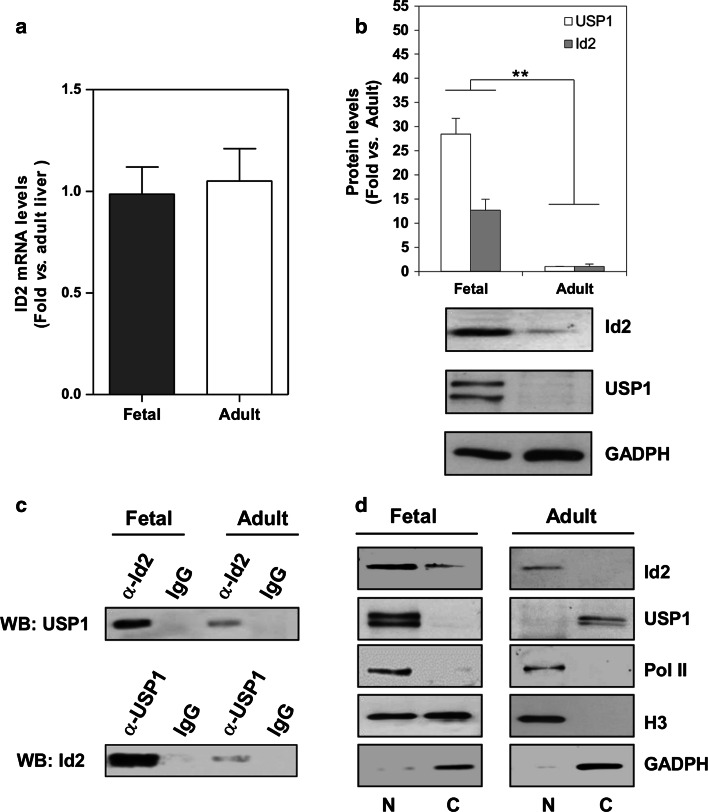
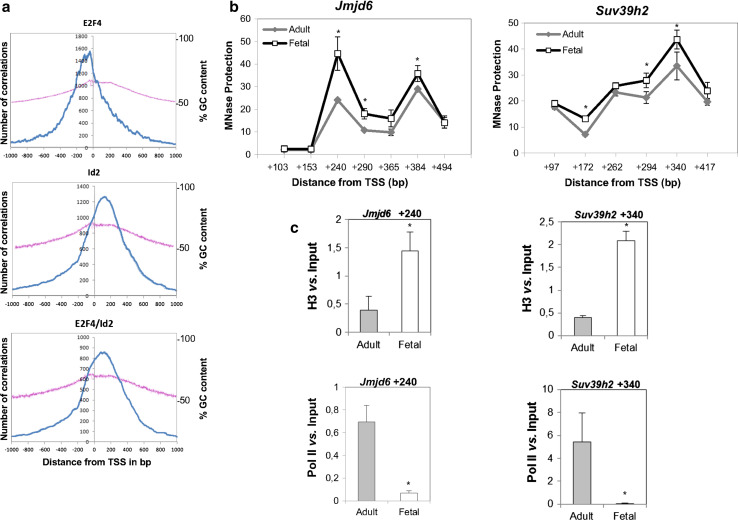
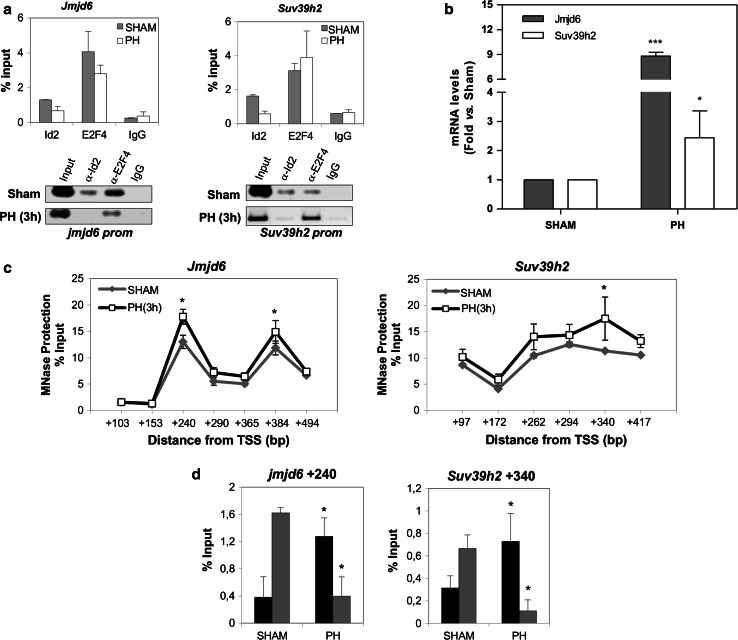
The inhibitor of differentiation Id2, a protein lacking the basic DNA-binding domain, is involved in the modulation of a number of biological processes. The molecular mechanisms explaining Id2 pleiotropic functions are poorly understood. Id2 and E2F4 are known to bind simultaneously to c-myc promoter. To study whether Id2 plays a global role on transcriptional regulation, we performed in vivo genome-wide ChIP/chip experiments for Id2 and E2F4 in adult mouse liver. An Id2-containing complex was bound to a common sequence downstream from the TSS on a subset of 442 E2F4 target genes mainly related to cell development and chromatin structure. We found a positive correlation between Id2 protein levels and the expression of E2F4/Id2 targets in fetal and adult liver. Id2 protein stability increased in fetal liver by interaction with USP1 de-ubiquitinating enzyme, which was induced during development. In adult liver, USP1 and Id2 levels dramatically decreased. In differentiated liver tissue, when Id2 concentration was low, E2F4/Id2 was bound to the same region as paused Pol II and target genes remained transcriptionally inactive. Conversely, in fetal liver when Id2 levels were increased, Id2 and Pol II were released from gene promoters and target genes up-regulated. During liver regeneration after partial hepatectomy, we obtained the same results as in fetal liver. Our results suggest that Id2 might be part of a reversible development-related program involved in the paused-ON/OFF state of Pol II on selected genes that would remain responsive to specific stimuli.


Figures

Fig. 1
Fig. 1
Identification of E2F4/Id2 target genes and binding site localization on gene promoters in mice liver. a Venn diagrams showing E2F4, Id2 and overlapping E2F4/Id2 target genes identified by ChIP/chip experiments in adult mice liver. Target genes were the result of at least three independent experiments analyzed by ChipInspector program. b E2F4 and Id2 region classification analysis. General annotation and statistics for total number of regions covered by E2F4 (9307), Id2 (871), or E2F4/Id2 (550). The type of genomic element and region enrichment compared to the genome is shown in the left graph for each protein. Details for regions overlapping with gene promoters are shown in the right graph as the percentage of input regions overlapping with either, at least one transcriptional start region (TSR), or at least one TSR and the first exon or intron of alternative transcripts (TSR, exon/intron). Gene promoter regions were extracted with RegionMiner program and subjected to an exhaustive analysis. Information of overlapping regions and gene IDs is shown in Online resource 3–5. c Distribution and location of E2F4, Id2, and E2F4/Id2 binding regions relative to the middle of a TSR (left) or a TSS (right). GenomeInspector analysis of tiling array data were plotted as the number of correlations found between target regions and the distance from the indicated genomic elements (labeled as 0) flanked by ±1,000 bp
Fig. 2
Fig. 2
Biological and functional characterization of E2F4/Id2 targets in adult liver. a Distribution of GO annotations assigned to a molecular function for E2F4/Id2 targets. The percentage is referred to the number of genes found within a particular category in relation to the total number of genes bound by E2F4/Id2 with an annotated GO molecular function. In some cases, genes may be included in more than one category. b Distribution of GO annotations assigned to E2F4/Id2-bound genes biological functions. Percentage of the most significant biological processes in which target genes have been described to be involved (left). Histogram depicts the percentage of genes found within most significant groups in relation to total E2F4/Id2-bound genes after an extensive and manual curated analysis (right). c Distribution of GO categories among genes bound by E2F4/Id2 vs. those bound by E2F4 alone. Black and gray bars represent E2F4/Id2 and E2F4 alone enrichment, respectively. E2F4/Id2, E2F4 alone, and total E2F4-bound regions showing a higher number of distance correlations from TSS were extracted and analyzed. Fold enrichment for each biological function was calculated compared to total E2F4-bound genes. Those categories found to be enriched in E2F4/Id2 vs. E2F4 targets are highlighted
Fig. 3
Fig. 3
Dynamics of Id2 binding and expression of EF4/Id2 targets in differentiated and undifferentiated liver tissue. a In-silico expression analysis of E2F4/Id2 target genes in adult and fetal liver. The expression of those E2F4/Id2 target genes showing a biological function enrichment vs. E2F4 alone targets was analyzed (www.bidmcgenomics.org/LiverDevReg/index.html). A box and whiskers graph representing mRNA levels in both liver tissues is shown. ***P < 0.0001 vs. adult liver. b Validation of ChIP/chip data and analysis of Id2 and E2F4 binding to selected genes in adult (gray bars) and E14 fetal liver (white bars) by ChIP assay. qChIPs (upper) and semiquantitative ChIPs (lower) carried out with specific primers for the indicated genes are shown. As a positive control in quiescent liver, E2F/Id2 binding to the c-myc promoter was analyzed. Data are the result of at least three independent experiments where the P value for Id2 binding was never higher than P < 0.05 vs. adult liver. c mRNA levels of selected genes in fetal vs. adult liver. RT-qPCR data, shown as fold (n = 5) are mean ± SEM. ***P < 0.0001 vs. adult mice
Fig. 4
Fig. 4
Id2 expression and subcellular distribution in fetal and adult mice liver. a Id2 mRNA levels were determined by RT-qPCR in liver tissue samples from adult and E14 fetal mice and plotted as fold vs. adult liver. Data (n = 5) are mean ± SEM. No significant difference was found. b Id2 and USP1 protein levels were analyzed by western blot. Protein levels were quantified, normalized by GAPDH levels, and plotted. Data (n ≥ 5) are mean ± SEM. **P < 0.001 vs. adult liver. c Id2-USP1 coimmunoprecipitation analysis. Samples from fetal and adult liver tissue were immunoprecipitated with either α-Id2 or α-USP1 and normal IgG antibodies. The immunoprecipitated Id2 (upper panel) was analyzed by western blot with α-USP1, Immunoprecipitated USP1 (lower panel) was analyzed by western blot with α-Id2. Inputs of either Id2 or USP1 are shown in (b). d Nuclear (N) and cytosolic (C) distribution of Id2 and USP1. Western blot analysis of Id2 and USP1 in nuclear and cytosolic fractions from adult and fetal liver samples. Fraction purity was assessed by western blot with specific antibodies for both Pol II and histone H3 (used as nuclear marker of non-proliferating tissues) and GAPDH (used as a cytosolic marker). Representative blots (n = 5) for C and D are shown
Fig. 5
Fig. 5
Impact of Id2 complex on nucleosome positioning at a high GC-content region downstream from TSS. a GC-content in total E2F4, Id2, and E2F4/Id2 binding regions relative to TSS (0). GenomeInspector analysis of tiling array data were plotted as the number of correlations found between target regions and the distance from TSS (labeled in blue) flanked by +/-1000 bp at the left axis. The percentage of GC content (pink line) in these regions is shown at the right axis. b qPCR analysis of nucleosome positioning at E2F4/Id2 binding region in fetal and adult liver. MNase protected regions at Jmjd6 (left) and Suv39h2 (right) were plotted as fold enrichment vs. distance from TSS (at the center of amplicons). Data (n = 3) are mean ± SEM. *P < 0.05 vs. adult liver. c Identification of complexes bound to MNase protected regions on Jmjd6 (left) and Suv39h2 (right) in liver samples from adult and fetal mice by Nuc-ChIP assay. Mononucleosome-enriched chromatin fragments were immunoprecipitated with either histone H3 (upper) or Pol II (lower) antibodies. Amplicons are centered at +240 and +340 bp from TSS for Jmjd6 and Suv39h2, respectively. Data (n = 3) are mean ± SEM. *P < 0.05 vs. adult liver
Fig. 6
Fig. 6
Id2 and Pol II coordinated release from gene promoters at the onset of liver regeneration. a Analysis of Id2 and E2F4 binding to Jmjd6 (left) and Suv39h2 (right) by qChIP in liver samples from sham operated mice and 3 h after PHx. qChIPs (upper) and semiquantitative ChIPs (lower) carried out with specific primers for the indicated genes are shown. Data are the result of at least three independent experiments where the P value for Id2 binding was never higher than P < 0.05 vs. sham operated mice. b mRNA levels of Jmjd6 (black) and Suv39h2 (gray) in liver tissue from 3 h PHx vs. sham operated animals. RT-qPCR data, shown as fold (n = 5) are mean ± SEM. ***P < 0.0001 vs. sham operated mice. c qPCR analysis of nucleosome positioning at E2F4/Id2 binding region in sham (SH) and 3 h PHx liver samples. Data were plotted as fold enrichment of normalized-MNase protected regions vs. distance from TSS (at the center of amplicons). Data (n = 3) are mean ± SEM. *P < 0.05 vs. sham. d Identification of complexes bound to MNase protected regions on Jmjd6 (left) and Suv39h2 (right) in liver samples from sham and 3 h PHx. Mononucleosome-enriched chromatin fragments were immunoprecipitated with either histone H3 (black) or Pol II (gray) antibodies. Amplicons are centered at +240 and +340 bp from TSS for Jmjd6 and Suv39h2, respectively. Data (n = 3) are mean ± SEM. *P < 0.05 vs. sham operated liver samples

Similar articles

Cited by

References

    1. Murre C, McCaw PS, Vaessin H, Caudy M, Jan LY, et al. Interactions between heterologous helix-loop-helix proteins generate complexes that bind specifically to a common DNA sequence. Cell. 1989;58:537–544. doi: 10.1016/0092-8674(89)90434-0. - DOI - PubMed
    1. Benezra R, Davis RL, Lockshon D, Turner DL, Weintraub H. The protein Id: a negative regulator of helix-loop-helix DNA binding proteins. Cell. 1990;61:49–59. doi: 10.1016/0092-8674(90)90214-Y. - DOI - PubMed
    1. Ruzinova MB, Benezra R. Id proteins in development, cell cycle and cancer. Trends Cell Biol. 2003;13:410–418. doi: 10.1016/S0962-8924(03)00147-8. - DOI - PubMed
    1. Lasorella A, Uo T, Iavarone A. Id proteins at the cross-road of development and cancer. Oncogene. 2001;20:8326–8333. doi: 10.1038/sj.onc.1205093. - DOI - PubMed
    1. Coma S, Amin DN, Shimizu A, Lasorella A, Iavarone A, et al. Id2 promotes tumor cell migration and invasion through transcriptional repression of semaphorin 3F. Cancer Res. 2010;70:3823–3832. doi: 10.1158/0008-5472.CAN-09-3048. - DOI - PMC - PubMed

Publication types

MeSH terms

LinkOut - more resources